
Extended Ambient Air Sampling for Beryllium in Peterborough
Extended Ambient Air Sampling for Beryllium in Peterborough (PDF)
Table of contents
1. Overview
The Canadian Nuclear Safety Commission (CNSC) carried out extended ambient air sampling for beryllium in Peterborough, Ontario, during July, August and September 2022. This report outlines the sampling methods and results, as well as the related conclusions and recommendations.
The sampling campaign was in response to concerns about beryllium emissions from the BWXT Nuclear Energy Canada (BWXT-NEC) Peterborough facility. At meetings and webinars with community members (e.g., BWXT Peterborough Community Liaison Committee), the CNSC heard that the community wanted extended ambient air monitoring for beryllium, in order to verify that beryllium levels in air are protective of human health and the environment around the facility. Extended ambient air monitoring would also help alleviate concerns about the safety of breathing the air around the facility and increase public trust in existing monitoring (conducted by both BWXT-NEC and the CNSC as part of its Independent Environmental Monitoring Program (IEMP)).
1.1 Sources of beryllium
Beryllium is one of the lightest metals that occurs naturally in the environment and is present in a variety of materials including rocks, coal, oil, soil, and volcanic dust. Natural sources of beryllium released to the atmosphere, such as windblown dust and volcanic particles, are estimated to account for 5.2 tonnes per year, or 2.6% of worldwide total emissions Footnote 2.
The most important sources of beryllium exposure come from human activities, such as the burning of coal, fuel oil and petroleum-based products. Beryllium emissions are also produced by foundries, ceramic plants, incinerators, municipal waste combustors, and open-burning waste disposal sites. Beryllium is used at the BWXT-NEC facility in Peterborough during the nuclear fuel bundle manufacturing process, which results in extremely low atmospheric emissions of beryllium from the facility Footnote 3.
1.2 Beryllium in soil
The CNSC conducted a public hearing from March 2 to 6, 2020. During the hearing, the Commission considered BWXT-NEC’s renewal application and heard 248 interventions. Several interventions expressed concerns over what appeared to be a trend of increasing beryllium in soil near the BWXT-NEC Peterborough facility, observed during the CNSC’s IEMP sampling campaigns in 2014, 2018 and 2019. CNSC staff outlined that the rationale for monitoring beryllium in soil is to account for the possibility that beryllium emitted from the stacks can be transported to the soil from air by gravitational settling and accumulation.
On April 6, 2020, the Commission directed CNSC staff to carry out expedited soil resampling for beryllium on properties adjacent to BWXT-NEC’s Peterborough facility, with a special focus on the Prince of Wales Public School Footnote 1. Results of this soil sampling found that all concentrations of beryllium in soil detected by partial digestion were in the range of natural background levels in Ontario, up to 2.5 milligrams/kilogram (mg/kg), and were also below the most restrictive levels (4 mg/kg) in the Canadian Council of Ministers of the Environment soil quality guideline for the protection of environmental and human health.
In renewing BWXT-NEC’s licence for a 10-year period, the Commission directed the licensee to monitor the receiving environment (soil) to demonstrate that the environment around the BWXT-NEC Peterborough facility continues to remain safe.
1.3 Air quality criteria for beryllium
The CNSC and the Ontario Ministry of the Environment, Conservation and Parks (MECP) use Ontario’s Ambient Air Quality Criteria (AAQC) for airborne releases of beryllium to assess risk to community members from airborne beryllium releases from the BWXT-NEC Peterborough facility. AAQC are used to assess general (ambient) air quality resulting from all sources of a contaminant to air. The AAQC for beryllium were developed based on the averaging of a 24-hour period of continuous air sampling. The criteria are derived with conservative assumptions of exposure where the limiting effect is health, and they consider both potential acute and chronic effects. The AAQC for beryllium is 0.01 micrograms per cubic metre of air (µg/m3). Stack monitoring results from the BWXT-NEC facility in Peterborough, which are reviewed by CNSC staff, show that the beryllium emissions are low and below the MECP’s AAQC of 0.01 µg/m3 prior to any dilution – with a maximum concentration ever measured at the stack of 0.009 µg/m3. The monitoring is done with a particulate filter system in the stack and filters are collected weekly and analyzed. This is reported to the CNSC annually Footnote 4. However, should any result exceed the beryllium action level of 0.03 µg/m3 at the stack (prior to dilution), immediate reporting to the CNSC would be required under its regulatory framework, as this indicates a loss of control of part of a licensee’s environmental protection program and triggers a requirement for specific action to be taken. BWXT-NEC Peterborough also has an internal control level equal to the MECP’s AAQC value of 0.01 µg/m3, where any exceedance triggers an internal investigation and corrective actions.
1.4 Working with the community
Following the expedited soil sampling campaign mentioned in section 1.1 and webinars to disseminate campaign results, some community members were still concerned about beryllium emissions the BWXT-NEC facility and requested ambient air monitoring. It was suggested that CNSC staff work with Dr. Julian Aherne, an intervenor at the March 2020 Commission hearing, and an associate professor at Trent University with expertise in environmental monitoring. The CNSC worked with Dr. Aherne to develop a community-specific air monitoring plan to verify that the amount of beryllium in air was not leading to increasing beryllium levels in soil. Dr. Aherne suggested extending air sampling over at least 3 days (~72 hours) at locations surrounding the facility with considerations for wind direction. In addition, air particulate samples analyzed for beryllium were collected using a high-volume air sampler for longer sample collection times (8 hours) than in past IEMP campaigns. The goal of longer collection time for these samples was to verify the results obtained from shorter air sampling times done over the past 4 IEMP campaigns. Findings from the past few IEMP air sampling campaigns have consistently found that levels of beryllium in air around the facility were below the detection limit, meaning that the amount found in the air was less than the amount that could be reliably measured with very sensitive analytical equipment (0.007 mg beryllium). Findings were also used to verify if air quality around the BWXT-NEC facility is meeting the AAQC for airborne releases of beryllium (0.01 µg/m3). CNSC staff prepared a sampling plan outlining the purpose and methods, and it was reviewed by Dr. Aherne and discussed with the BWXT Peterborough Community Liaison Committee and Peterborough Public Health.
2. Methods
2.1 Sampling sites
The CNSC conducted a walkabout with Dr. Aherne in April 2022 to discuss the project and identify possible sampling locations around the facility. The main criteria for sampling locations were the wind direction (to ensure a maximum yield of collected beryllium) and the availability of a power supply. A plug-in power supply was necessary to power the air sampler for a prolonged period of time without continuous supervision, while reducing the noise and pollution that would otherwise come from using a generator. The 3 locations chosen are shown in figure 1.
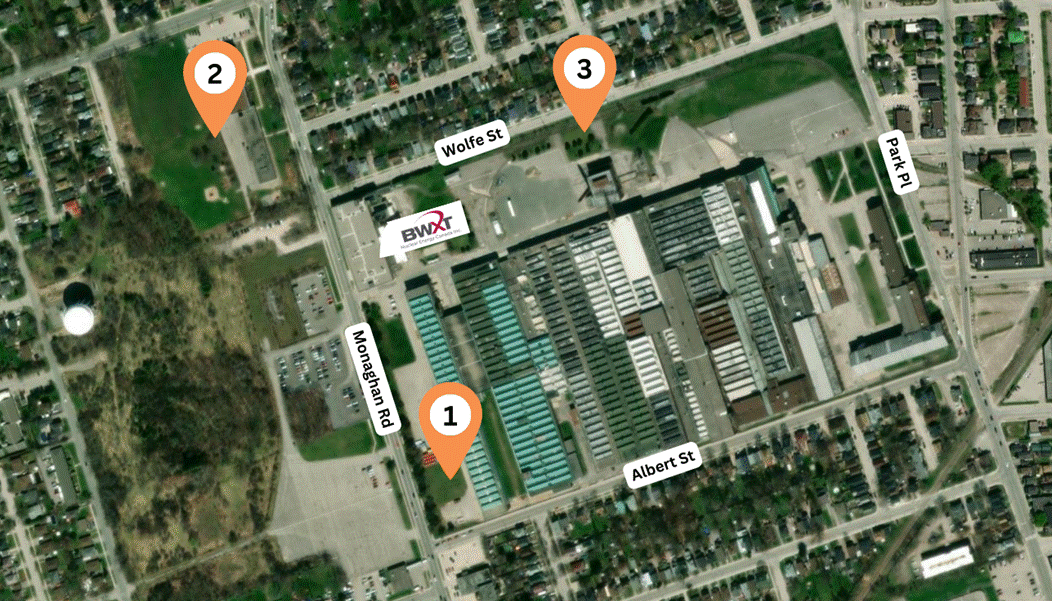
Figure 1: Text version
Satellite map indicating the three air sampling locations using orange pointers. Sampling point 1 is southwest, sampling point 2 is northwest, and sampling point 3 is northeast of the BWXT-NEC Peterborough Facility.
2.2 Sampling methods
The air particulate samples were collected by running a Hi-Q high-volume HVP3300 BRL sampler with cellulose filters (8” x 10” ashless cellulose filter paper – Whatman Grade 41: 20–25 micrometres) continuously for up to 72 hours Footnote 5Footnote 6. The filters were then packed in sealed polyethylene zipper bags and transported in “no fold” cardboard envelopes to the CNSC Laboratory. A field blank was also collected at each sampling location by taking a new filter and packaging and transporting it in the same way as the sample filter.
2.3 Analysis methods
For each sampling location, 1 field sample, 1 field blank and 1 laboratory blank (new filter taken randomly from the box of filters) were aliquoted and digested in a 4:1 nitric acid:hydrogen peroxide mixture in a laboratory microwave. Upon completion of the digestion, which fully dissolved the filters and collected particulate matter, the resulting acid solutions were diluted by a factor of 20 times and were analyzed by inductively coupled plasma mass spectrometry. Quality control samples consisting of new filters that were spiked with beryllium, and digestion blanks consisting of only the acid mixture with no filter present were also analyzed. All filters (field samples and blanks) were analyzed for beryllium using modified OSHA methodology Footnote 7.
3. Results
3.1 Weather and wind direction during sampling
Wind activity and weather can impact the amount of beryllium collected on the filter. Prior to sampling, CNSC did a literature search to determine if there was any similar sampling conducted for beryllium in air. The results of the one study found on monitoring of beryllium in air (conducted by the Lawrence Livermore National Laboratory) showed seasonal variability of the concentration of beryllium in air. The maximum beryllium in air was measured in late summer/early fall, due to the lower precipitation and higher wind activity in that time period Footnote 6. To maximize the potential for beryllium collection, the CNSC sampling was performed in July, August and September 2022.
Data on wind and weather during sampling events are shown in table 1.
| Sampling location | Date | Wind | Weather | Flow rate (litres per minute)1 |
|---|---|---|---|---|
| 1 | 2022-07-11 | Afternoon: SSW 16 km/h Evening: S 8 km/h | Sunny at drop-off (2:00 pm) 28°C Thunderstorm (7:30 pm) 24°C | 1,300 |
| 1 | 2022-07-12 | Morning: SW 7km/h Afternoon: W 20 km/h | Overcast with light rain 19°C Mostly cloudy 25°C | 1,200 |
| 1 | 2022-07-13 | Morning: NW 4 km/h Afternoon: W10 km/h | Overcast and rain 20°C Sunny with clouds 25°C | 1,200 |
| 1 | 2022-07-14 | Morning: NW 19 km/h Afternoon: NW 12 km/h | Sunny 20°C Sunny 25°C | 1,200 |
| 2 | 2022-08-30 | Afternoon: S 10 km/h Evening: S 14 km/h | Overcast with light rain 22°C Sunny 21°C | 1,200 |
| 2 | 2022-08-31 | Morning: SW 12 km/h Afternoon: W 25 km/h | Mostly cloudy 22°C Mostly cloudy 25°C | 1,200 |
| 2 | 2022-09-01 | Morning: WNW 17 km/h Afternoon: NW 21 km/h | Sunny 18°C Sunny 21°C | 1,200 |
| 2 | 2022-09-02 | Morning: S 7 km/h Afternoon: S 16 km/h | Sunny 24°C Sunny 26°C | 1,200 |
| 3 | 2022-09-20 | Afternoon: NNW 17 km/h Evening: NNW 2 km/h | Overcast 22°C Foggy 21°C | 1,200 |
| 3 | 2022-09-21 | Morning: S 7 km/h Afternoon: SSW 15 km/h | Sunny with fog 23°C Sunny 25°C2 | 1,200 |
1 It is common for the flow rate to decrease as the filter collects material
2 Sampling terminated early (September 21, 2022, 3:50 pm) due to noise complaints from nearby residents
3.2 Logistical challenges
Sampling had to be terminated early at the third location, as the noise from running the air sampler resulted in noise complaints from nearby residents. CNSC staff worked with BWXT and General Electric staff to try and mitigate the noise by parking a truck between the sampler and the fence to buffer the noise for residents living across the street from the site. However, doing so only minimally impacted the noise levels. The decision was made to end this sample early, and the air sampler was turned off at 3:50 pm and disconnected from the General Electric building power supply. The sample medium was removed from the sampler at 5:30 pm and was bagged, labeled, sealed, secured, and removed from the location by CNSC staff. The total sample collection time was 25.8 hours. The other 2 locations were sampled over a period of approximately 72 hours.
3.3 Results
The results of the analyses of the 3 air samples collected in the vicinity of BWXT-NEC facility in Peterborough based on continuous air monitoring are summarized in table 2. Note that the measurement uncertainty, as noted in the table, is at the 95% confidence level (i.e., 2 standard deviations). This is to say that CNSC staff are confident that 95 out of 100 times the estimate will fall between the upper and lower values specified by the confidence interval.
The analytical method has very high sensitivity, as demonstrated by the low method limit of detection (LOD). The method LOD = 0.007 mg beryllium per air filter and is derived from the background signal of beryllium measured in the field blanks and laboratory filter blanks. This background signal is equivalent to an amount of beryllium present in a whole filter with 95% confidence, regardless of the volume of air drawn through the filter.
The limit of quantification (LOQ) is calculated by dividing the method LOD by the volume of air drawn through the filter. The LOQ is the smallest concentration of beryllium that can be reliably measured by CNSC staff’s analytical methods. Note that the LOQ (in mg/m3) for the third sample is higher because of the smaller air volume drawn (air sample collection time was 25.8 hours).
| Sampling location | Dates of sample collection | Volume drawn, m3 | Beryllium, mg/m3 | Uncertainty, mg/m3 | Method LOD1, mg Beryllium | LOQ2, mg Beryllium/m3 |
|---|---|---|---|---|---|---|
| 1 | 11-Jul-22 1:43 pm to 14-Jul-22 1:28 pm | 5,306 | 0.0000056 | 0.0000019 | 0.007 | 0.0000013 |
| 2 | 29-Aug-22 3:36 pm to 01-Sep-22 2:25 pm | 5,310 | <0.0000013 | NA3 | 0.007 | 0.0000013 |
| 3 | 20-Sep-22 2:00 pm to 21-Sep-22 5:15 pm | 1,935 | <0.0000036 | NA3 | 0.007 | 0.0000036 |
1LOD: limit of detection
2LOQ: limit of quantification
3NA: Uncertainty cannot be calculated as no measurable beryllium found on sample
Only the first location had an extremely small amount of measurable beryllium (5.6x10⁻⁶µg/m3). The other 2 locations did not have beryllium above LOQ= 1.3x10⁻⁶ mg/m3, indicating no measurable beryllium was found on the sample.
The value of 5.6x10⁻⁶ µg/m3 is in good agreement with the highest values, ~20x10-6 µg/m3, measured by the Lawrence Livermore National Laboratory beryllium monitoring program Footnote 6 in 2010, and believed to originate from naturally occurring beryllium. The Lawrence Livermore National Laboratory has a multi-year environmental monitoring program, which uses similar analytical methodology to the CNSC laboratory. As such, this results in data that is comparable to ours. The maximum measured concentration of beryllium in air is a very small fraction (only 0.056%) of the air quality limit in Ontario (0.01 mg/m3). Any health impacts from beryllium are not expected at these levels.
Of note, in comparison with previous IEMP sampling campaigns, the sampling and analysis methodology was changed for this extended air-sampling text in order to increase the sensitivity of beryllium analysis. For example, one change was with the type of filters used; the literature has shown that the higher sensitivity of environmental detection of beryllium is achieved by using cellulose instead of fiberglass air filters Footnote 6. Cellulose filters are known to have negligible background concentration of beryllium, thereby maximizing the potential of finding any beryllium when sampled. The sensitivity also depends on the duration of the sampling (i.e., the longer the sample collection time, the lower the quantification limit of beryllium). CNSC staff sampled for a period of up to about 72 hours and the filter was noticeably dirty. It is important to note that sampling longer may not be practical as the filter would likely become very dirty and clogged by dust particles. Clogged filters can significantly reduce sample flow rates and invalidate the sample.
4. Conclusions
The CNSC carried out extended ambient air monitoring for beryllium near the BWXT-NEC Peterborough facility to further verify that levels of beryllium in air are protective of human health and the environment around the facility. The following conclusions were drawn based on the extended air sampling campaign:
- A very small amount of beryllium was measured in 1 of the 3 samples. This measurable beryllium can be coming from a number of natural and human activities.
- Results confirm that levels of beryllium in air are negligible and well below air quality guidelines that are protective of human health and the environment.
- Extended air sampling results showed that even when sampling times are increased to 72 hours (compared to 8 hours during a regular IEMP sample), the amount of beryllium in air is extremely low and does not pose any risk to the health of the community or the environment at these concentrations.
- The newly developed extended air sampling method, while accurate and reliable, has several challenges like noise pollution, availability of power, clogged filters, and the need for supervision.
CNSC staff continue to conclude that there is no risk to the environment or to human health from beryllium in locations surrounding the BWXT-NEC Peterborough facility.
5. Recommendations
Based on the aforementioned conclusions, CNSC staff recommend the following:
- The existing IEMP air sampling conducted approximately once every 3 years, along with annual soil sampling by the licensee, is adequate to assess impact of beryllium emissions from BWXT-NEC’s Peterborough facility.
- The newly developed extended air sampling method may be used as a reactive method in case of any elevated results from the current monitoring methods.
- CNSC staff should disseminate the results from this campaign in 2023.
Acronyms and units
- AAQC
- Ambient Air Quality Criteria
- BWXT-NEC
- BWXT Nuclear Energy Canada Inc.
- CCME
- Canadian Council of Ministers of the Environment
- CNSC
- Canadian Nuclear Safety Commission
- IEMP
- Independent Environmental Monitoring Program
- kg
- kilogram
- m3
- cubic metre
- MECP
- Ministry of the Environment, Conservation and Parks
- mg
- milligram
- µg
- microgram
Footnotes
- Footnote 1
-
Canadian Nuclear Safety Commission (CNSC), Notice of Continuation of Public Hearing, April 6, 2020.
- Footnote 2
-
World Health Organization, International Programme on Chemical Safety, Environmental Health Criteria 106. Geneva, 1990.
- Footnote 3
-
CNSC, BWXT Public Hearing Transcript, March 2–6, 2020.
- Footnote 4
-
BWXT Nuclear Energy Canada, Annual Compliance Monitoring Report, 2021.
- Footnote 5
-
ASTM International, ASTM Standard D 4096-17, Standard Test Method for Determination of Total Suspended Particulate Matter in the Atmosphere (High–Volume Sampler Method). West Conshohocken, PA, 2017. https://www.astm.org/
- Footnote 6
-
M. Sutton, R. K. Bibby, G. R. Eppich, S. Lee, R. E. Lindvall, K. Wilson and B. K. Esser, 2012. Evaluation of historical beryllium abundance in soils, airborne particulates and facilities at Lawrence Livermore National Laboratory. Sci. Total Env. 437: 373–83.
- Footnote 7
-
Occupational Safety and Health Administration, Beryllium and compounds, 2021.
Page details
- Date modified: