
Regulatory Oversight Report for Canadian Nuclear Laboratories Sites: 2019
Table of contents
- EXECUTIVE SUMMARY
- 1 INTRODUCTION
- 2 CANADIAN NUCLEAR LABORATORIES
- 3 THE CNSC’S REGULATORY OVERSIGHT OF CNL
- 4 THE CNSC’S ASSESSMENT OF SAFETY AT CNL SITES
- 5 EVENTS AND OTHER MATTERS OF REGULATORY INTEREST
- 6 OVERALL CONCLUSIONS
- ACRONYMS
- A. LIST OF INSPECTIONS AT CNL SITES IN 2019
- B. REGDOC IMPLEMENTATION
- C. SAFETY AND CONTROL AREA RATINGS, 2015-2019
- D. TOTAL ANNUAL RELEASE OF RADIONUCLIDES
- E. ESTIMATED DOSE TO THE PUBLIC
- F. DOSES TO NUCLEAR ENERGY WORKERS AND NON-NUCLEAR ENERGY WORKERS AT CNL SITES
- G. LOST-TIME INJURY INFORMATION
- H. PARTICIPANT FUNDING AWARDED FOR THE 2019 CNL REGULATORY OVERSIGHT REPORT
- I. INDIGENOUS COMMUNITIES AND GROUPS WHOSE TRADITIONAL AND/OR TREATY TERRITORIES ARE IN PROXIMITY TO CNL SITES
Executive Summary
The Regulatory Oversight Report for Canadian Nuclear Laboratories Sites: 2019 is a Commission member document (CMD) which presents the Canadian Nuclear Safety Commission (CNSC) staff’s assessment of licensee performance at sites that are licensed to Canadian Nuclear Laboratories (CNL) for the 2019 calendar year. This report also provides an update on CNSC staff’s activities related to public information, community engagement and relevant aspects of the CNSC’s Independent Environmental Monitoring Program.
CNSC staff use the safety and control area framework to evaluate the performance of each licensee. This report provides performance ratings for all 14 safety and control areas (SCAs). It focuses on radiation protection, environmental protection and conventional health and safety, in particular. Taken together, these SCAs provide a meaningful overview of the safety performance of the facilities addressed in this report.
The report also includes information on the licensee’s public information programs, its engagement with Indigenous groups and communities, reportable events, and areas of increased regulatory focus, where applicable to the sites. It also provides updates to matters discussed at the Whiteshell Laboratories’ licence renewal Commission Hearing held in October 2019; namely an update on the security SCA and preliminary information on the potential effects on the collective occupational dose from the proposed accelerated decommissioning.
In order to assess the safety performance of licensees, the CNSC conducts regulatory oversight activities consisting of onsite inspections, technical assessments, reviews of reports submitted by licensees, reviews of events and incidents, general communication with licensees, and exchanges of information with them. While licensee performance across all SCAs is not explicitly documented in this report, CNSC staff’s regulatory oversight activities extend to all SCAs.
CNSC staff have rated CNL’s performance at its sitesFootnote 1 in 2019 in each SCA as either “satisfactory” (SA) or “below expectations” (BE), as shown in the following table:
| SCA | CRL | WL | PHP | PGP | DP | G-1 | NPD |
|---|---|---|---|---|---|---|---|
| Management system | SA | SA | SA | SA | SA | SA | SA |
| Human performance management | SA | SA | SA | SA | SA | SA | SA |
| Operating performance | SA | SA | SA | SA | SA | SA | SA |
| Safety analysis | SA | SA | SA | SA | SA | SA | SA |
| Physical design | SA | SA | SA | SA | SA | SA | SA |
| Fitness for service | SA | SA | SA | SA | SA | SA | SA |
| Radiation protection | SA | SA | SA | SA | SA | SA | SA |
| Conventional health and safety | SA | SA | SA | SA | SA | SA | SA |
| Environmental protection | SA | SA | SA | SA | SA | SA | SA |
| Emergency management and fire protection | SA | SA | SA | SA | SA | SA | SA |
| Waste management | SA | SA | SA | SA | SA | SA | SA |
| Security | SA | BE | SA | SA | SA | SA | SA |
| Safeguards and non-proliferation | SA | SA | SA | SA | SA | SA | SA |
| Packaging and transport | SA | SA | SA | SA | SA | SA | SA |
CNSC staff confirm that in 2019, CNL sites continued to perform licensed activities safely. For this reporting year, CNSC staff rated all SCAs as “satisfactory” with the exception of the security SCA at Whiteshell Laboratories which was rated as “below expectations”, the same rating as 2018.
Overall, CNSC staff’s compliance activities determined that:
- radiation protection programs at all sites adequately controlled radiation exposures, keeping doses as low as reasonably achievable (ALARA)
- environmental protection programs at all sites were effective at protecting people and the environment
- conventional health and safety programs at all sites continued to protect workers
Therefore, CNSC staff conclude that in 2019, the CNL sites covered by this regulatory oversight report made adequate provisions for the health and safety of workers, the protection of the public and the environment, and Canada’s international obligations.
1 Introduction
For the purposes of the Nuclear Safety and Control Act (NSCA), and its associated Regulations, the Canadian Nuclear Safety Commission (CNSC) regulates Canada’s nuclear industry to protect the health, safety, security and the environment; to implement Canada’s international commitments on the peaceful use of nuclear energy; and to disseminate objective scientific, technical and regulatory information to the public. Licensees are responsible for operating their facilities safely, and are required to implement programs that make adequate provision for meeting legislative and regulatory requirements.
The Commission has directed CNSC staff to report to the Commission annually on the safety performance of sites operated by Canadian Nuclear Laboratories (CNL) in the form of a regulatory oversight report (ROR). This ROR provides an overview of CNSC regulatory efforts and staff’s assessment of licensee performance at sites operated by CNL for the 2019 calendar year.
The CNL sites covered by this report are:
- Chalk River Laboratories (CRL)
- Whiteshell Laboratories (WL)
- Port Hope Area Initiative (PHAI)
- Port Hope Project (PHP)
- Port Granby Project (PGP)
- Port Hope Pine Street Extension Temporary Storage Site
- Port Hope Radioactive Waste Management Facility
- Douglas Point (DP) Waste Facility
- Gentilly-1 (G-1) Waste Facility
- Nuclear Power Demonstration (NPD) Waste Facility
This report focuses on radiation protection, environmental protection, and conventional health and safety, as they provide a good overview of safety performance at CNL sites. The report also provides an overview of licensee operations, licence changes, major developments at licensed facilities and sites, and reportable events. In addition, the report includes information on CNL’s public information programs, engagement with Indigenous groups and communities, Waste and Decommissioning and the CNSC’s Independent Environmental Monitoring Program (IEMP). It also provides updates to matters discussed at the WL licence renewal Commission Hearing held in October 2019, namely an update on the Security SCA and information on the potential effects on the collective occupational dose from the proposed accelerated decommissioning. The information in this document is complementary to the information provided in the PowerPoint presentation titled Regulatory Oversight Report for Canadian Nuclear Laboratories Sites: 2019 CMD 20-M22.A.
2 Canadian Nuclear Laboratories
CNL is responsible for the operation and management of nuclear sites owned by Atomic Energy of Canada Limited (AECL) under a Government-Owned, Contractor-Operated model.
A brief overview of each CNL site is provided below, with a link to the CNSC web page that contains more details such as facility information, announcements, regulatory reporting and other key topics.
2.1 Chalk River Laboratories
Chalk River Laboratories (CRL) is located in the province of Ontario, 160 kilometers (km) northwest of Ottawa. CRL operates under a single licence that includes Class I and Class II nuclear facilities, waste management areas, radioisotope laboratories, support facilities and offices. The CRL site continues to undergo a period of change. Where permitted by the current licensing basis, CNL is shutting down and decommissioning legacy facilities, and constructing and commissioning replacement facilities throughout the site. Further information on CRL is available on the CNSC’s Website at: http://nuclearsafety.gc.ca/eng/reactors/research-reactors/chalk-river/index
CNL continues work on the proposal to construct and operate a Near-Surface Disposal Facility (NSDF) at the CRL site. This project is currently under review by CNSC staff, is subject to an environmental assessment pursuant to the Canadian Environmental Assessment Act, 2012, and will require authorizations from the Commission. Additionally, Global First Power is proposing a small modular reactor at the CRL site. This project is also undergoing an environmental assessment with Global First Power as the proponent. Because there will be separate Commission decisions on these projects, they are not specifically discussed in further detail in this ROR.
2.2 Whiteshell Laboratories
Whiteshell Laboratories (WL) is a former nuclear research and test facility located near Pinawa, Manitoba that was established in the early 1960s. The site hosts the 60 megawatt thermal (MWth) Whiteshell Reactor No. 1 (WR-1), a SLOWPOKE demonstration reactor, other research and support facilities, and a waste management area that contains low-level waste (LLW), intermediate-level waste and high-level radioactive waste. The WR-1 and SLOWPOKE reactors were permanently shut down in 1985 and 1990 respectively. Decommissioning activities at WL commenced in 2003. Further information on WL is available on the CNSC’s Website at: http://nuclearsafety.gc.ca/eng/reactors/research-reactors/other-reactor-facilities/whiteshell-laboratories.
In 2016, the CNSC received an application by CNL to change the decommissioning approach for WR-1 from full dismantlement to in situ decommissioning. This proposed approach is currently under review by CNSC staff, is subject to an environmental assessment pursuant to the Canadian Environmental Assessment Act, 2012, and will require authorization from the Commission. As there will be separate Commission decisions on this project, it is not specifically discussed further in this ROR.
2.3 Port Hope Area Initiative
The Port Hope Area Initiative (PHAI) consists of the Port Hope Project (PHP) and the Port Granby Project (PGP). The scope of the PHAI is defined by a legal agreement between the Municipalities of Port Hope and Clarington and the Government of Canada, originally signed in 2001. These projects involve the clean-up of historic low-level radioactive waste contamination found in Port Hope and Port Granby, and its emplacement in new long-term waste management facilities (LTWMFs) located in each community.
The Port Hope Pine Street Extension Temporary Storage Site and the Port Hope Radioactive Waste Management Facility are small temporary storage sites for low level waste that are being remediated as part of the PHP. As such, they are included under the PHP in this report.
Further information on the PHAI is available on the CNSC’s Website at: http://nuclearsafety.gc.ca/eng/waste/historic-nuclear-waste/port-hope-area-initiative/index.
2.4 Prototype Power Reactors
The Douglas Point (DP), Gentilly-1 (G-1), and Nuclear Power Demonstration (NPD) waste facilities are three prototype power reactors that are currently safely shut down and undergoing decommissioning activities of hazard reduction and waste characterization, in line with plans reviewed and accepted by CNSC staff. These prototype reactors are required to implement and maintain programs such as radiation protection, occupational health and safety, security and fire protection.
2.4.1 Douglas Point Waste Facility
DP, located in Tiverton, Ontario on the Bruce nuclear site is a partially decommissioned prototype power reactor. The 200-megawatt electric (MWe) prototype Canada deuterium uranium (CANDU) power reactor was put into service in 1968 and permanently shut down in 1984. CNL safely manages low- and intermediate-level radioactive wastes, as well as used nuclear fuel stored in concrete dry storage canisters at the site. CNL is also undertaking decommissioning planning activities. Further information on DP is available on the CNSC’s Website at: http://nuclearsafety.gc.ca/eng/reactors/research-reactors/other-reactor-facilities/douglas-point-waste-facility.
In July of 2019, CNL submitted to the CNSC an application for a licence amendment to allow CNL to begin dismantlement work at DP. This work includes a discrete set of proposed decommissioning activities that form part of a proposed multi-stage, 50-year decommissioning project. The scope of this amendment request does not include decommissioning of the Spent Fuel Canister Area or the Reactor Building. CNSC staff’s assessment of the DP application can be found in CMD 20-H4. This request is subject to a separate Commission Hearing scheduled for November 2020.Footnote 2
2.4.2 Gentilly-1 Waste Facility
G-1, located in Bécancour, Québec within Hydro-Québec’s Gentilly-2 site, is a partially decommissioned prototype power reactor. The 250 MWe boiling water reactor was put into service in 1972 and shut down in 1984. At G-1, CNL safely manages low- and intermediate-level radioactive wastes, as well as used nuclear fuel in concrete dry storage canisters. Additionally, CNL is undertaking decommissioning planning activities. Further information on G-1 is available on the CNSC’s Website at: http://nuclearsafety.gc.ca/eng/reactors/research-reactors/other-reactor-facilities/gentilly-1-facility.
2.4.3 Nuclear Power Demonstration Waste Facility
NPD, located in Rolphton, Ontario, is a partially decommissioned prototype power reactor. The 20 MWe prototype CANDU power reactor was placed into service in 1962 and operated until 1987. At NPD, CNL safely manages low- and intermediate-level radioactive wastes. Additionally, CNL is undertaking decommissioning planning activities. Further information on NPD is available on the CNSC’s Website at: http://nuclearsafety.gc.ca/eng/reactors/research-reactors/other-reactor-facilities/nuclear-power-demonstration.
In 2016, CNL submitted an application to the CNSC to modify the decommissioning approach for NPD from full dismantling to in situ decommissioning, which could accelerate the decommissioning process. This application is under review by CNSC staff, is subject to an environmental assessment pursuant to the Canadian Environmental Assessment Act 2012, and will require authorization from the Commission. Because there will be a separate Commission decision on this project, it is not specifically discussed further in this ROR.
3 THE CNSC’S REGULATORY OVERSIGHT OF CNL
The CNSC performs regulatory oversight of licensed facilities to verify compliance with the requirements of the NSCA and associated Regulations made under the NSCA, each site’s licence and licence conditions handbook (LCH), and any other applicable standards and regulatory documents.
CNSC staff use the Safety and Control Area (SCA) framework to assess, evaluate, review, verify and report on licensee performance. The SCA framework includes 14 SCAs, which are subdivided into specific areas that define its key components. Further information on the CNSC’s SCA framework can be found on the CNSC’s Website at: http://www.nuclearsafety.gc.ca/eng/resources/publications/reports/powerindustry/safety-and-control-areas.
3.1 Regulatory Activities
CNSC staff spent over 33,500 hours in 2019 working on licensing and compliance activities for CNL sites. This included effort from CNSC staff in 36 different divisions spread over nine directorates.
Compliance
The CNSC ensures licensee compliance through verification, enforcement and reporting activities. CNSC staff implement compliance plans for each site by conducting regulatory activities including on-site inspections, desktop reviews and technical assessments of licensee programs, processes and reports.
In 2019, CNSC staff spent over 17,400 hours on compliance activities, including 14,500 hours performing desktop reviews and technical assessments of licensee documents and 2,900 hours conducting inspections. Appendix A contains a list of CNSC inspections carried out at each CNL site in 2019. All findings in these inspections were considered low-risk and did not have an impact on safety at CNL sites.
Licensing
In 2019, CNSC staff spent over 16,100 hours on licensing activities, which includes drafting new licences, preparing Commission member documents, and drafting or revising LCHs. A summary of licensing activities is below:
| Site, Facility or Project | Licence Changes | LCH Changes |
|---|---|---|
| Chalk River Laboratories | None | Revised LCH issued February 2019 |
| Whiteshell Laboratories | 5-year licence issued December 2019 | New LCH issued January 2020 |
| Port Granby Project | Licence amendment with new release limits, April 2019 | New LCH issued April 2019 |
Douglas Point, Gentilly-1 & | Separation of single licence into individual licences for each site, February 2019 | New LCHs issued, one applicable to each site:
|
As CNSC regulatory documents are published, CNSC staff update the LCHs as applicable for each site, taking into consideration the licensee’s implementation plans. CNSC staff verify the implementation as part of ongoing compliance verification activities. Appendix B provides a list of CNSC regulatory documents implemented at CNL sites and used by CNSC staff for compliance verification.
International Atomic Energy Agency (IAEA) Safeguards Activities
Under the terms of the Canada-IAEA safeguards agreements, the IAEA has the right to perform independent verification activities at various types of sites in Canada. The PGP is the only site covered by this ROR which is not under IAEA safeguards, as the PGP site does not possess safeguarded materials. IAEA activities are not CNSC compliance inspections, but CNSC staff accompany the IAEA in roughly 75% of their activities.
In 2019, the IAEA carried out activities at CRL, WL, PHP, DP, and G-1 to verify nuclear material inventories and assure the absence of undeclared nuclear material and activities. No significant issues were identified.
3.2 Performance Ratings 2019
Performance ratings result from regulatory oversight activities. CNSC staff have rated CNL’s performance in each SCA as either “satisfactory” (SA) or “below expectations” (BE).
| SCA | CRL | WL | PHP | PGP | DP | G-1 | NPD |
|---|---|---|---|---|---|---|---|
| Management system | SA | SA | SA | SA | SA | SA | SA |
| Human performance management | SA | SA | SA | SA | SA | SA | SA |
| Operating performance | SA | SA | SA | SA | SA | SA | SA |
| Safety analysis | SA | SA | SA | SA | SA | SA | SA |
| Physical design | SA | SA | SA | SA | SA | SA | SA |
| Fitness for service | SA | SA | SA | SA | SA | SA | SA |
| Radiation protection | SA | SA | SA | SA | SA | SA | SA |
| Conventional health and safety | SA | SA | SA | SA | SA | SA | SA |
| Environmental protection | SA | SA | SA | SA | SA | SA | SA |
| Emergency management and fire protection | SA | SA | SA | SA | SA | SA | SA |
| Waste management | SA | SA | SA | SA | SA | SA | SA |
| Security | SA | BE | SA | SA | SA | SA | SA |
| Safeguards and non-proliferation | SA | SA | SA | SA | SA | SA | SA |
| Packaging and transport | SA | SA | SA | SA | SA | SA | SA |
Appendix C provides SCA ratings for each site from 2015 to 2019.
For 2019, CNSC staff rated all SCAs for all CNL sites as “satisfactory”, with the exception that CNSC staff have evaluated the Security SCA at WL as ‘below expectations’.
Update on Repatriation of Highly Enriched Uranium (HEU)
Under the joint regulatory oversight of the CNSC and the United States Nuclear Regulatory Commission (USNRC), CNL has been safely returning materials which contain HEU to the United States. The HEU originates from materials imported to Canada for research and medical isotope production at CRL. The movement of HEU is also monitored by the IAEA. In 2019, CNL continued fuel and liquid HEU repatriation activities, with six shipments completed. CNSC staff have assessed CNL’s repatriation work and concluded that it continues safely.
Update on Security SCA at WL
CNSC staff have evaluated CNL’s 2019 performance at the WL site for the Security SCA as “below expectations”, the same rating as 2018. In 2018, CNSC staff raised concerns regarding CNL’s security program at Whiteshell Laboratories. These concerns led to the CNSC issuing an Order to CNL to implement changes to CNL’s security posture at the site. In September of 2019, CNL submitted a corrective action plan to the CNSC to address identified deficiencies, while implementing interim compensatory measures that were reviewed and accepted by CNSC staff. CNL is providing regular progress updates on the status of the actions identified in the corrective action plan.
Closure of the CNSC Order is contingent on CNL completing the implementation of the corrective action plan. CNL has made significant progress, and CNSC staff expect that CNL will complete all actions identified in the corrective action plan, as well as additional response force training and procurement, by the end of September 2020.
4 The CNSC’s assessment of Safety at CNL sites
The CNSC regulates all aspects of safety at nuclear sites in Canada, including risks to workers, the public and the environment. Information related to the SCAs of radiation protection, environmental protection and conventional health and safety are most representative of CNL’s overall safety performance. In particular, the SCAs of radiation protection and conventional health and safety are a good measure of the safety of workers at CNL sites, while the SCA of environmental protection is a good measure of the safety of the public and the environment.
For both the radiation protection and environmental protection SCAs, the concept of Action Levels (ALs) is used. ALs are a specific dose of radiation or other parameter that serve as an early warning to safeguard against exceedances of radiation dose limits and environmental release limits. Action level exceedances are reportable to the CNSC.
4.1 Environmental Protection
Protection of the environment and the public are linked in the SCA of environmental protection. This SCA covers programs that identify, control and monitor all releases of radioactive and hazardous substances, and the effects on the environment from facilities or as a result of licensed activities.
Currently, all CNL sites covered by this ROR have acceptable environmental protection programs in place to ensure the protection of the public and the environment. For 2019, CNSC staff rated the environmental protection SCA at all CNL licensed sites as “satisfactory”.
Appendix D provides the total annual releases of radionuclides for each CNL site from 2015 to 2019. Appendix E contains data on dose to the public for each CNL site from 2015 to 2019.
Effluent and Emissions Control at CNL sites
CNL implements effluent and environmental monitoring programs at all sites covered by this ROR.
Emissions: CNL reported three action level exceedances at CRL for releases of radioactive substances to air. Two of the exceedances were in adjacent weeks at the Waste Management facilities and were related to the transfer of waste bags with higher than normal quantities of tritium. The third was related to work in the Universal Cells facility due to internal cross contamination from a higher activity cell to a lower activity cell. CNSC staff have assessed that the risk to the public and the environment from these exceedances is negligible.
Effluents: There was one exceedance of the Wastewater Systems Effluent Regulations (WSER) limits at CRL in 2019. This was an exceedance of total suspended solids applicable to the B1425 Sanitary Sewage Treatment Facility effluent. CNL reported one action level exceedance at PGP for arsenic, uranium, molybdenum and radium-226 in effluent due to higher influent feed water concentration and temperature. CNL also reported a release of untreated water from the PGP to Lake Ontario and the Port Granby Creek following a heavy rain event in July 2019.
At all CNL sites, airborne and waterborne releases of radioactive and hazardous substances remained below their respective regulatory limits in 2019. CNSC staff conclude that the effluent verification monitoring programs in place for CNL facilities protect the environment and the public.
CNL’s Environmental Management System
The CNSC requires that licensees develop and maintain an Environmental Management System (EMS) in order to provide a documented framework for integrated activities related to environmental protection. CNL has established a corporate EMS which applies to all CNL sites in Canada. Through regular compliance verification activities, CNSC staff confirmed that CNL’s corporate EMS conforms to International Standards Organization (ISO) 14001: Environmental Management Systems, and the EMSs for CRL and WL are registered to ISO 14001:2015.
Assessment and monitoring
CNL has implemented an Environmental Monitoring Program (EMP) at its facilities, which complies with the CSA N288.4: Environmental Monitoring Program at Class I Nuclear Facilities and Uranium Mines and Mills.
Through compliance activities conducted during 2019, CNSC staff concluded that environmental monitoring conducted at CNL sites and the discharge of treated effluent from CNL sites met regulatory requirements. CNSC staff assessment of CNL’s EMP annual report results for the year 2019 confirm that the EMP in place for CNL facilities protects the environment and the public.
Environmental Risk Assessment
The Environmental Risk Assessment (ERA) is a systematic process used to identify, quantify and characterize the risk posed by contaminants and physical stressors in the environment to human and non-human (biological) receptors.
In 2019, CNL submitted an ERA for DP and an updated ERA for CRL. CNSC staff determined that the ERAs are compliant with the CSA Standard N288.6-12: Environmental Risk Assessments at Class I Nuclear Facilities and Uranium Mines and Mills. CNSC staff’s assessment of the DP ERA can be found in CMD 20-H4, related to the DP licence amendment request.
A Safety Analysis Report (SAR) was submitted for G-1 in 2019 that included information demonstrating that operations do not pose an unreasonable risk to human health and the environment.
Protection of the Public
CNL is required to demonstrate that the health and safety of the public are protected from exposures to hazardous substances released from its licensed operations. The effluent and environmental monitoring programs are used to verify that releases of hazardous substances do not result in environmental concentrations that may affect public health.
The CNSC receives reports of discharges to the environment through the reporting requirements outlined in CNL’s licences and LCHs. CNSC staff assessment of CNL’s Environmental Monitoring Program annual report results for non-radiological (hazardous substances) at CNL facilities for the year 2019, conclude that CNL met regulatory requirements.
Estimated dose to the public
As part of annual reporting to the CNSC, CNL provides data on dose to a hypothetical member of the public that is representative of someone who spends considerable time in proximity to the licensed site.
In all cases, CNL’s data indicates that doses to the public resulting from CNL’s operations are well below the 1 mSv limit prescribed in the Radiation Protection Regulations. At no point during 2019 did the emissions from the CRL site exceed the constraint for dose to the public of 0.30 mSv/year (y) indicated in the CRL LCH. Additionally, the maximum estimated doses to the public from CNL sites were from the PGP at 0.0396 mSv and the PHP at 0.0360 mSv, which are both less than 4% of the regulatory annual dose limit of 1 mSv.
4.2 Radiation Protection
The Radiation Protection SCA covers the implementation of a radiation protection program in accordance with the Radiation Protection Regulations. CNL sites are required to implement and maintain a radiation protection program to ensure that contamination levels and radiation doses received by individuals are monitored, controlled and maintained as low as reasonably achievable (ALARA).
For 2019, CNSC staff rated the radiation protection SCA at all CNL licensed sites as “satisfactory”.
Appendix F contains data on dose to workers for each CNL site from 2015 to 2019.
Application of ALARA
CNL’s application of ALARA within the radiation protection program includes management commitment and oversight, personnel qualification and training, design analyses of facilities and systems, provision of protective equipment and ALARA assessments/reviews of radiological activities.
In 2019, CNL continued to effectively implement the ALARA program at its sites. This program integrates ALARA into design, planning, management and control of radiological activities, and is based on current industry best practices and operating experience. Of note in 2019, CNL introduced a new Radiological Work Permit form that identifies radiological hazards and radiation protection controls in a consistent manner, which in turn increases the effectiveness of pre-job briefings.
WL Decommissioning ALARA Assessment
In the Record of Decision from the October 2019 WL licence renewal Commission Hearing, the Commission requested that CNSC staff provide a systematic assessment of the potential effects on the collective occupational dose from the proposed accelerated decommissioning. In order to provide this information to the Commission, CNSC staff requested that CNL perform an ALARA assessment addressing the impacts of accelerated decommissioning. CNL submitted this assessment to the CNSC on July 30, 2020. This assessment included the potential impact of accelerated decommissioning on both collective and individual doses.
The total collective dose for the accelerated decommissioning approach is estimated to be 520 person-millisievertsFootnote 3 (p-mSv), compared to a total collective dose estimate of 205 p-mSv for the alternative selected in the 2002 Comprehensive Study Report (end-state achieved in a 60 year period). This 520 p-mSv collective dose estimate includes workers at both WL and CRL and assumes in situ decommissioning of the WR-1 Reactor and low-level waste management trenches, with the activities concluding in the year 2027.
CNSC staff’s preliminary conclusion is that the current suite of action levels (which includes a maximum annual dose of 6 mSv) are appropriate to provide assurance that worker exposures will be managed and controlled during the proposed period of accelerated decommissioning. CNSC staff will provide another update to the Commission after CNSC staff have completed their analysis of CNL’s ALARA assessment.
Worker dose control
Workers, including employees and contractors, conducting work activities which present a reasonable probability that the worker may receive an occupational dose greater than 1 mSv/y, are identified as Nuclear Energy Workers (NEWs). Workers, whose job function do not present a reasonable probability of receiving an occupational dose greater than 1 mSv/y are considered non-NEWs.
In 2019, no worker received a radiation dose in excess of the CNSC regulatory dose limits. The maximum dose received by a NEW at CNL sites was at CRL, with a dose of 8.23 mSv, which is approximately 16 percent of the regulatory limit for effective dose of 50 mSv in a one-year dosimetry period.
Radiation protection program performance
Radiation protection program performance at CNL sites was assessed in 2019 through CNSC staff compliance activities.
CNSC staff approved revisions to the PHAI RP Plan for the PHP and PGP in February 2019, which included updates to the action levels for radiological exposures to be more aligned with current work activities. CNL revised the action levels at DP and G-1 based on reviews of historical dosimetry results and planned activities. The revised actions levels for both sites were submitted to the CNSC in December 2019 and accepted by CNSC staff in March 2020.
In 2019, no radiation protection action levels were exceeded.
Radiological hazard control
Radiation and contamination monitoring programs continued to be implemented at CNL’s sites in 2019, to control and minimize radiological hazards and the spread of radioactive contamination. Dose rate measurements and, where appropriate, in-plant air monitoring are routinely performed to confirm that radiation exposures are kept ALARA.
The radiological hazard surveys conducted in 2019 by CNL’s staff did not identify any adverse trends, and were consistent with expected radiological conditions.
In April 2019, CNL had 4 skin contamination events occur within a 1 week period associated with the removal of contaminated piping at WL. While the respiratory protection specified provided adequate protection against inhalation intakes, CNL determined that improvements in protective clothing were necessary to prevent worker body contamination. Based on this operating experience, CNL suspended work, changed the suits used during these activities, and provided further training to staff on dress/undress procedures to ensure all proper protocols were being followed. Work resumed in September 2019, and no further skin contaminations were reported. CNSC staff is satisfied with CNL’s corrective actions. None of these skin contamination events resulted in an action level exceedance.
4.3 Conventional Health and Safety
The conventional health and safety SCA covers the implementation of a program to manage workplace safety hazards and protect workers. CNL licenced sites must develop, implement and maintain effective safety programs to promote safe and healthy workplaces and minimize incidences of occupational injuries and illnesses.
For 2019, CNSC staff rated the conventional health and safety SCA at all CNL licenced sites as “satisfactory”.
Appendix G contains health and safety information for each CNL site from 2015 to 2019.
Practices
During 2019, CNSC staff verified CNL safety practices during compliance inspections and site walk-downs, as well as during desktop reviews and technical assessments.
CNL conducted a company-wide safety stand down on May 30, with that day dedicated to raising safety awareness and strengthening work practices.
Performance
The key performance indicators for conventional health and safety are the number of recordable lost-time injuries (RLTI) that occur per year, RLTI severity and RLTI frequency. An RLTI is defined as a workplace injury that results in the worker being unable to return to work for a period of time.
In 2019, there was 1 RLTI at CRL, 2 at PHP, and 2 at PGP. One RLTI at PGP was a serious incident involving a contract worker who was injured by the unloading mechanism of a roll-off bin truck and was airlifted to a hospital in Toronto for medical treatment. This event was presented to the Commission in CMD 19-M9, and is discussed further in Section 5.1 of this report.
There were no RLTIs at WL, NPD, G-1, and DP in 2019.
5 Events and Other Matters of Regulatory interest
5.1 Reportable Events
Detailed requirements for reporting unplanned situations or events at CNL licensed sites to the CNSC are included in the applicable LCH. CNSC Regulatory Document 3.1.2 Reporting Requirements for Non-Power Reactor Class I Facilities and Uranium Mines and Mills came into force for applicable CNL sites in January 2019. Over the period covered by this report, CNL has complied with the requirements for submission of these reports.
For reportable events which occurred in 2019, CNSC staff are satisfied with CNL’s corrective actions.
Events which CNSC staff assess as meeting specific risk criteria are the subject of “Event Initial Reports” from CNSC staff to the Commission. In 2019, there were two Event Initial Reports which were both presented to the Commission on February 20, 2019:
- Worker injured on January 9, 2019 at Port Granby Project, in which a contractor was pinned by the unloading mechanism of a roll-off bin truck, presented to the Commission in CMD 19-M9. Immediately following the event, CNL suspended the use of trucks with roll-off bins at all of its operations in Canada while it conducted an investigation and developed corrective actions to prevent recurrence. Corrective actions included bulletins regarding safety around remotely operated mechanisms at all sites, and training for persons operating such mechanisms. CNSC staff subsequently verified implementation of these corrective actions during an inspection.
- Power Outage on February 3, 2019 at Chalk River Laboratories, presented to the Commission in CMD 19-M10. CNL determined that the power outage was the result of an electrical malfunction of a 2400V distribution cable. CNSC staff reviewed CNL’s Root Cause Analysis for this event and found it to be a thorough assessment of the root causes of the event, which relate to aging infrastructure at the CRL site. CNSC staff also assessed that CNL’s corrective and remedial actions will reduce the risk of a similar event in the future, and the consequences of such an event should one occur. CNSC staff performed an inspection at CRL in March 2020 that followed up on the site-wide power outage that confirmed the implementation of CNL’s corrective actions.
CNSC staff are satisfied that CNL responded appropriately to these incidents and implemented appropriate corrective actions in response to each event.
5.2 Public Engagement
The area of public engagement has two aspects, those of activities carried out directly by CNSC staff, and of activities carried out by CNL.
5.2.1 CNSC
The NSCA mandates the CNSC to disseminate objective scientific, technical and regulatory information to the public concerning its activities and the activities it regulates. CNSC staff fulfill this mandate in a variety of ways, including hosting in-person and virtual information sessions and through annual regulatory reports. CNSC staff also participate in local community events as well as CNL led public meetings. CNSC staff also seek out other opportunities to engage with the public and Indigenous groups, often participating in meetings or events in communities with interest in nuclear sites. These allow CNSC staff to answer questions about the CNSC’s mandate and role in regulating the nuclear industry, including CNL’s sites.
CNSC staff carried out over a dozen outreach activities in 2019, which were targeted at, or otherwise relevant to, CNL sites. Some of these activities were targeted to specific regulatory review processes underway, including the WL licence renewal, DP licence amendment, CNL ROR, NSDF and the WL and NPD in situ decommissioning projects. CNSC staff hosted webinars and attended open houses, trade fairs, public markets, municipal Fairs, environmental stewardship meetings such as:
- Lac du Bonnet Trade Fair
- WL Open House (at WL site)
- Pinawa Birthday Celebrations Town Market
- Manitoba Metis Federation Annual General Assembly
- Petawawa Showcase weekend
- Renfrew fair
- Port Hope Fall Fair
- CNSC WL licence renewal webinar
- CNSC ROR webinar
These outreach activities are separate from CNSC staff’s Indigenous engagement activities.
CNSC awarded over $41,000 in participant funding to assist Indigenous peoples, members of the public and stakeholders in reviewing this ROR and submitting comments to the Commission, as detailed in Appendix H. CNSC staff is also hosting public webinars to provide information on this ROR and the CNSC.
5.2.2 Canadian Nuclear Laboratories
To ensure open and transparent information about nuclear facilities is available to the public, the CNSC requires licensees to implement and maintain a public information program and disclosure protocol (PIDP).
CNSC staff monitor CNL’s implementation of its public information and disclosure programs to verify CNL communicates regularly with its audiences in a way that is meaningful to them. CNSC staff review yearly program updates to verify CNL is taking audience feedback into consideration and taking steps to implement program adjustments to meet the evolving needs of its audiences.
Of note in 2019, CNSC staff performed an in-depth inspection of CNL’s public information program for the PHAI. This inspection ran over a two-month period. During this period, CNSC staff assessed the information provided to the public by CNL for the PHP and the PGP for accessibility and content. CNSC staff observed CNL’s interactions with the public by attending multiple community engagement activities performed by CNL. This inspection concluded that CNL effectively implements public information program requirements for the PHAI.
5.3 Indigenous Consultation and Engagement
5.3.1 CNSC
As an agent of the Government of Canada and as Canada's nuclear regulator, the CNSC recognizes and understands the importance of consulting and building relationships with Indigenous peoples in Canada. CNSC staff are committed to building long-term relationships with Indigenous groups who have interest in CNSC-regulated facilities within their traditional and/or treaty territories. By pursuing informative and collaborative ongoing interactions, the CNSC's goal is to build partnerships and trust. The CNSC's Indigenous engagement practices, which include information sharing and funding support (through the CNSC's Participant Funding Program) for Indigenous peoples to meaningfully participate in Commission proceedings and ongoing regulatory activities, are consistent with the principles of upholding the honour of the Crown and reconciliation.
CNL sites fall within the traditional and treaty territories of many Indigenous communities, as listed in Appendix I. CNSC staff efforts in 2019 supported the CNSC’s ongoing commitment to meeting its consultation obligations and building relationships with Indigenous peoples. In particular, CNSC staff continued to work to meet its Duty to Consult obligations with regards to CNL’s proposed projects undergoing environmental assessments and licence amendments or renewals. CNSC staff also continued to identify opportunities for formalized and regular engagement throughout the lifecycle of CNL sites, including meetings and workshops upon request. Through this engagement, CNSC staff welcomed the opportunity to discuss and address all topics of interest and concern to the Indigenous communities.
5.3.2 Canadian Nuclear Laboratories
CNSC staff note that CNL has a dedicated Indigenous engagement program that covers CNL’s operations and activities. CNL met and shared information with interested Indigenous communities and organizations throughout 2019.
CNSC staff continue to be satisfied with the level and quality of Indigenous engagement conducted by CNL with regards to its operations and proposed projects at its different sites. CNSC staff encourages CNL to continue to remain flexible and responsive to the requests and needs of the communities that have an interest in its sites, facilities and proposed projects.
5.4 Waste and Decommissioning
CNL’s activities at each of the sites covered by this report involve the generation, storage and management of radioactive wastes. CNL has pursued accelerated decommissioning strategies at many of its sites, resulting in an actual or planned increase in the rate of generation of radioactive wastes.
Radioactive wastes stored on the sites covered by this report consist of high, intermediate and low-level radioactive waste. The inventory of wastes stored at CNL sites is included in the sixth Canadian National Report for the Joint Convention on the Safety of Spent Fuel Management and on the Safety of Radioactive Waste Management (October 2017). The report can be found on the CNSC’s website. The next meeting of the Joint Convention on the Safety of Spent Fuel Management and on the Safety of Radioactive Waste Management will take place in May 2021. Canada’s Seventh National Report will be released in the spring of 2021 and will be available on the CNSC’s website.
During the reporting period, CNL enhanced its decommissioning program with the release of the Environmental Remediation Process, which is initiated when an environmental remediation is required or a CNL site requires investigation. In terms of reducing its legacy liability, throughout 2019 CNL continued to execute decommissioning and remediation activities at all of its sites.
CNSC staff maintain oversight of CNL’s current and future management of radioactive wastes via inspections, desktop reviews, and technical assessments. During 2019, CNL employed effective programs to safely manage radioactive and hazardous wastes from CNL’s licensed activities and decommissioning of its facilities as authorized by the Commission.
5.5 Independent Environmental Monitoring Program (IEMP)
In addition to licensees carrying out required monitoring of their operations, the CNSC carries out its IEMP to verify and confirm that the public and the environment around licensed nuclear facilities remain safe. Further information on the CNSC’s IEMP, including sampling results and associated standards, can be found on the CNSC’s Website at: http://www.nuclearsafety.gc.ca/eng/resources/maps-of-nuclear-facilities/iemp/index-iemp.
In 2019, CNSC staff conducted independent environmental monitoring around the CRL, DP, PHP and PGP sites. IEMP results for the areas surrounding these sites indicate that the public and the environment in the vicinity of these sites are protected.
6 Overall Conclusions
CNSC staff conclude that the CRL, WL, PHAI, DP, G-1 and NPD sites operated safely in 2019. This conclusion is based on CNSC staff’s assessments of licensee activities that included site inspections, reviews of reports submitted by licensees, and event and incident reviews, supported by follow-up and general communication with the licensee.
For 2019, the performance in all 14 SCAs was rated as “satisfactory” with the exception of the Security SCA at WL, which was rated “below expectations”.
CNSC staff’s compliance activities confirmed that:
- Environmental protection programs at all CNL sites were effective in protecting the environment;
- Radiation protection programs at all CNL sites adequately controlled radiation exposures, keeping doses ALARA; and
- Conventional health and safety programs at all CNL sites continue to protect workers.
CNSC staff will continue to provide regulatory oversight at all CNL sites, to ensure that CNL continues to make adequate provision to protect the health, safety and security of workers, Canadians and the environment, and continues to implement Canada’s international obligations on the peaceful use of nuclear energy.
ACRONYMS
- AECL
- Atomic Energy of Canada Limited
- AL
- Action Level
- ALARA
- As Low As Reasonably Achievable
- BE
- Below Expectations
- Bq
- Becquerel
- CANDU
- Canada Deuterium Uranium
- CMD
- Commission Member Document
- CNL
- Canadian Nuclear Laboratories
- CNSC
- Canadian Nuclear Safety Commission
- CRL
- Chalk River Laboratories
- CSA
- Canadian Standards Association
- DP
- Douglas Point
- DRL
- Derived Release Limits
- EMP
- Environmental Monitoring Program
- EMS
- Environmental Management System
- EPD
- Electronic Personal Dosimeters
- ERA
- Environmental Risk Assessment
- G-1
- Gentilly-1
- HEU
- Highly Enriched Uranium
- Hrs
- Hours
- HTO
- Hydrogenated tritium oxide; also called tritiated water
- IAEA
- International Atomic Energy Agency
- IEMP
- Independent Environmental Monitoring Program
- ISO
- International Standards Organization
- kg
- Kilogram
- km
- Kilometers
- LCH
- Licence Conditions Handbook
- LLW
- Low-Level Waste
- LTWMF
- Long-Term Waste Management Facility
- MBq
- Megabecquerel
- MeV
- Megaelectron Volt
- mSv
- Millisievert
- MWe
- Megawatt Electric
- MWth
- Megawatt Thermal
- NEW
- Nuclear Energy Worker
- NPD
- Nuclear Power Demonstration
- NSDF
- Near-Surface Disposal Facility
- NSCA
- Nuclear Safety and Control Act
- NRU
- National Research Universal
- PGP
- Port Granby Project
- PHAI
- Port Hope Area Initiative
- PHP
- Port Hope Project
- p-mSv
- Person-Millisieverts
- PIDP
- Public Information and Disclosure Program
- RLTI
- Recordable Lost-Time Injuries
- ROR
- Regulatory Oversight Report
- SA
- Satisfactory
- SAR
- Safety Analysis Report
- SCA
- Safety and Control Area
- SWS
- Storage with Surveillance
- USNRC
- United States Nuclear Regulatory Commission
- WL
- Whiteshell Laboratories
- WR-1
- Whiteshell Reactor No. 1
- WSER
- Wastewater Systems Effluent Regulations
- Y
- Year
A. LIST OF INSPECTIONS AT CNL SITES IN 2019
| Inspection | Dates | SCAs Covered |
|---|---|---|
| CNL-CRL-2019-01: Transportation of Dangerous Goods | March 21 - 22, 2019 |
|
| CNL-CRL-2019-02: ZED 2 | September 4 - 5, 2019 |
|
| Security Field Inspection | May 16, 2019 |
|
| Security Field Inspection | May 17, 2019 |
|
| CNL-CRL-2019-03: Waste and Decommissioning | September 4 - 5, 2019 |
|
| Security Field Inspection | September 18, 2019 |
|
| CNL-CRL-2019-04: Emergency Transport Exercise | October 9, 2019 |
|
| Inspection | Dates | SCAs Covered |
|---|---|---|
| CNL-WL-2019-01: Packaging and Transport | June 6 - 7, 2019 |
|
| CNL-WL-2019-02: Fire Protection | August 6 - 8, 2019 |
|
| Security Field Inspection | August 26 - 28, 2019 |
|
| Security Exercise | November 28, 2019 |
|
| Inspection | Dates | SCAs Covered |
|---|---|---|
| CNL-PHAI-PHP-2019-01: Waste Water Treatment Plant | January 23 - 25, 2019 |
|
| CNL-PHAI-PHP-2019-02: Training | March 11 - 13, 2019 |
|
| CNL-PHAI-PHP-2019-03 and CNL-PHAI-PHP-2019-04: Waste Movement RP Transport | March 26 - 27, 2019 |
|
| CNL-PHAI-PHP-2019-05: General Inspection | August 15 - 16 2019 |
|
| CNL-PHAI-PHP-2019-06: Public Information Program | September 30 - November 29, 2019 |
|
| CNL-PHAI-PHP-2019-07: Small Scale Site Remediation Verification | October 1 - 2, 2019 |
|
| CNL-PHAI-PHP-2019-08: Cell Integrity | November 14 -15, 2019 |
|
| Inspection | Dates | SCAs Covered |
|---|---|---|
| CNL-PHAI-PGP-2019-01: Waste Water Treatment Plant | January 23 - 25, 2019 |
|
| CNL-PHAI-PGP-2019-02: Cell Capping | May 29 - 30, 2019 |
|
| CNL-PHAI-PGP-2019 -03: Slope Stability | May 29 - 30, 2019 |
|
| CNL-PHAI-PGP-2019-04: Public Information Program | September 30 - November 29, 2019 |
|
| CNL-PHAI-PGP-2019-05: Remediation Verification | October 2 - 4, 2019 |
|
| CNL-PHAI-PGP-2019-06: Radiation Protection | October 2 - 4, 2019 |
|
| CNL-PHAI-PGP-2019-07: Cell Capping | November 13 - 14, 2019 |
|
| Inspection | Dates | SCAs Covered |
|---|---|---|
| CNL-G1-2019-01: General Type II Inspection | August 27, 2019 |
|
| Inspection | Dates | SCAs Covered |
|---|---|---|
| Security Field Inspection | May 30, 2019 |
|
B. REGDOC IMPLEMENTATION
| Document Number | Document Title | Version | Status |
|---|---|---|---|
| REGDOC-2.1.2 | Management System: Safety Culture | 2018 | Implemented |
| REGDOC-2.2.4 | Fitness for Duty: Managing Worker Fatigue | 2017 | Implemented |
| REGDOC-2.2.4 | Fitness for Duty, Volume II: Managing Alcohol and Drug Use, version 2 | 2017 | To be determined |
| REGDOC-2.2.4 | Fitness for Duty, Volume III: Nuclear Security Officer Medical, Physical, and Psychological Fitness | 2018 | Implemented |
| REGDOC-2.4.1 | Deterministic Safety Analysis | 2014 | Implemented |
| REGDOC-2.5.7 | Design, Testing and Performance of Exposure Devices | 2017 | Implemented |
| REGDOC-2.6.3 | Aging Management | 2014 | Implemented |
| REGDOC-2.9.1 | Environmental Principles, Assessments and Protection Measures, version 1.1 | 2017 | Gap analysis due December 2020 |
| REGDOC-2.10.1 | Nuclear Emergency Preparedness and Response, Version 2 | 2016 | Implemented |
| REGDOC-2.12.1 (prescribed information) | High-Security Sites, Volume I: Nuclear Response Force | 2013 | Implemented |
REGDOC-2.12.1 (prescribed information) | High-Security Facilities, Volume II: Criteria for Nuclear Security Systems and Devices | 2018 | Implemented |
| REGDOC-2.12.2 | Site Access Security Clearance | 2013 | Implemented |
| REGDOC-2.12.3 | Security of Nuclear Substances: Sealed Sources | 2013 | Implemented |
| REGDOC-2.13.1 | Safeguards and Nuclear Material Accountancy | 2018 | Implemented |
| REGDOC-3.1.2 | Reporting Requirements, Volume I: Non-Power Reactor Class I Nuclear Facilities and Uranium Mines and Mills | 2018 | Implemented |
| REGDOC-3.2.1 | Public Information and Disclosure | 2018 | Gap analysis due December 2020 |
| Document Number | Document Title | Version | Status |
|---|---|---|---|
| REGDOC-2.1.2 | Management System: Safety Culture | 2018 | Implemented |
| REGDOC-2.2.2 | Personnel Training, version 2 | 2016 | Effective January 1, 2020 |
| REGDOC-2.2.4 | Fitness for Duty: Managing Worker Fatigue | 2017 | Effective January 1, 2020 |
| REGDOC-2.2.4 | Fitness for Duty, Volume II: Managing Alcohol and Drug Use, version 2 | 2017 | TBD |
| REGDOC-2.2.4 | Fitness for Duty, Volume III: Nuclear Security Officer Medical, Physical, and Psychological Fitness | 2018 | Effective October 2020 |
| REGDOC 2.4.3 | Nuclear Criticality Safety | 2018 | Effective January 1, 2020 |
| REGDOC-2.9.1 | Environmental Principles, Assessments and Protection Measures, version 1.1 | 2017 | Gap analysis due December 2020 |
| REGDOC-2.10.1 | Nuclear Emergency Preparedness and Response, Version 2 | 2016 | Effective January 1, 2020 |
| REGDOC-2.12.1 (prescribed information) | High-Security Sites, Volume I: Nuclear Response Force | 2013 | Effective January 1, 2020 |
REGDOC-2.12.1 (prescribed information) | High-Security Facilities, Volume II: Criteria for Nuclear Security Systems and Devices | 2018 | Effective January 1, 2020 |
| REGDOC-2.12.2 | Site Access Security Clearance | 2013 | Effective January 1, 2020 |
| REGDOC-2.12.3 | Security of Nuclear Substances: Sealed Sources | 2013 | Effective January 1, 2020 |
| REGDOC-2.13.1 | Safeguards and Nuclear Material Accountancy | 2018 | Effective January 1, 2020 |
| REGDOC-3.1.2 | Reporting Requirements, Volume I: Non-Power Reactor Class I Nuclear Facilities and Uranium Mines and Mills | 2018 | Implemented |
| REGDOC-3.2.1 | Public Information and Disclosure | 2018 | Gap analysis due December 2020 |
| Document Number | Document Title | Version | Status |
|---|---|---|---|
| REGDOC-2.2.2 | Personnel Training, version 2 | 2016 | Effective October 2021 |
| REGDOC-2.9.1 | Environmental Principles, Assessments and Protection Measures, version 1.1 | 2017 | Gap analysis due December 2020 |
| Document Number | Document Title | Version | Status |
|---|---|---|---|
| REGDOC-2.2.2 | Personnel Training, version 2 | 2016 | Effective October 2021 |
| REGDOC-2.9.1 | Environmental Principles, Assessments and Protection Measures, version 1.1 | 2017 | Gap analysis due December 2020 |
| Document Number | Document Title | Version | Status |
|---|---|---|---|
| REGDOC-2.1.2 | Management System: Safety Culture | 2018 | Implemented |
| REGDOC-2.2.2 | Personnel Training, Version 2 | 2016 | Effective June 1, 2020 |
| REGDOC-2.6.3 | Aging Management | 2014 | Implemented |
| REGDOC-2.9.1 | Environmental Protection: Environmental Protection Policies, Programs and Procedures (2013) | 2013 | Implemented |
| REGDOC-2.9.1 | Environmental Protection: Environmental Principles, Assessments and Protection Measures, version 1.1 | 2017 | Gap analysis due December 2020 Effective December 2021 |
| REGDOC-2.10.1 | Nuclear Emergency Preparedness and Response, Version 2 | 2016 | Effective July 1, 2020 |
| REGDOC-2.13.1 | Safeguards and Nuclear Material Accountancy | 2018 | Implemented |
| REGDOC-3.1.2 | Reporting Requirements, Volume I: Non-Power Reactor Class I Nuclear Facilities and Uranium Mines and Mills | 2018 | Implemented |
| REGDOC-3.2.1 | Public Information and Disclosure | 2018 | Gap analysis due December 2020 |
C. SAFETY AND CONTROL AREA RATINGS, 2015-2019
The following acronyms are used in this appendix:
SA = satisfactory, BE = below expectations
| Safety and control areas | 2015 | 2016 | 2017 | 2018 | 2019 |
|---|---|---|---|---|---|
| Management system | SA | SA | SA | SA | SA |
| Human performance management | SA | SA | SA | SA | SA |
| Operating performance | SA | SA | SA | SA | SA |
| Safety analysis | SA | SA | SA | SA | SA |
| Physical design | SA | SA | SA | SA | SA |
| Fitness for service | BE | BE | SA | SA | SA |
| Radiation protection | SA | SA | SA | SA | SA |
| Conventional health and safety | SA | SA | SA | SA | SA |
| Environmental protection | SA | SA | SA | SA | SA |
| Emergency management and fire protection | SA | SA | SA | SA | SA |
| Waste management | SA | SA | SA | SA | SA |
| Security | SA | SA | SA | SA | SA |
| Safeguards and non-proliferation | SA | SA | SA | SA | SA |
| Packaging and transport | SA | SA | SA | SA | SA |
| Safety and control areas | 2015 | 2016 | 2017 | 2018 | 2019 |
|---|---|---|---|---|---|
| Management system | SA | SA | SA | SA | SA |
| Human performance management | SA | SA | SA | SA | SA |
| Operating performance | SA | SA | SA | SA | SA |
| Safety analysis | SA | SA | SA | SA | SA |
| Physical design | SA | SA | SA | SA | SA |
| Fitness for service | SA | SA | SA | SA | SA |
| Radiation protection | SA | SA | SA | SA | SA |
| Conventional health and safety | SA | SA | SA | SA | SA |
| Environmental protection | SA | SA | SA | SA | SA |
| Emergency management and fire protection | SA | SA | SA | SA | SA |
| Waste management | SA | SA | SA | SA | SA |
| Security | SA | SA | SA | BE | BE |
| Safeguards and non-proliferation | SA | SA | SA | SA | SA |
| Packaging and transport | SA | SA | SA | SA | SA |
| Safety and control areas | 2015 | 2016 | 2017 | 2018 | 2019 |
|---|---|---|---|---|---|
| Management system | SA | SA | SA | SA | SA |
| Human performance management | SA | SA | SA | SA | SA |
| Operating performance | SA | SA | SA | SA | SA |
| Safety analysis | SA | SA | SA | SA | SA |
| Physical design | SA | SA | SA | SA | SA |
| Fitness for service | SA | SA | SA | SA | SA |
| Radiation protection | SA | SA | SA | SA | SA |
| Conventional health and safety | SA | SA | SA | SA | SA |
| Environmental protection | SA | SA | SA | SA | SA |
| Emergency management and fire protection | SA | SA | SA | SA | SA |
| Waste management | SA | SA | SA | SA | SA |
| Security | SA | SA | SA | SA | SA |
| Safeguards and non-proliferation | SA | SA | SA | SA | SA |
| Packaging and transport | SA | SA | SA | SA | SA |
| Safety and control areas | 2015 | 2016 | 2017 | 2018 | 2019 |
|---|---|---|---|---|---|
| Management system | SA | SA | SA | SA | SA |
| Human performance management | SA | SA | SA | SA | SA |
| Operating performance | SA | SA | SA | SA | SA |
| Safety analysis | SA | SA | SA | SA | SA |
| Physical design | SA | SA | SA | SA | SA |
| Fitness for service | SA | SA | SA | SA | SA |
| Radiation protection | SA | SA | SA | SA | SA |
| Conventional health and safety | SA | SA | SA | SA | SA |
| Environmental protection | SA | SA | SA | SA | SA |
| Emergency management and fire protection | SA | SA | SA | SA | SA |
| Waste management | SA | SA | SA | SA | SA |
| Security | SA | SA | SA | SA | SA |
| Safeguards and non-proliferation | SA | SA | SA | SA | SA |
| Packaging and transport | SA | SA | SA | SA | SA |
D. TOTAL ANNUAL RELEASE OF RADIONUCLIDES
Licensees are required to demonstrate that their releases are below their Derived Release Limits (DRL) and that the sum of their release are below 1 mSv/y, which is the public regulatory dose limit. To ensure these limits are respected, licensees also are required to develop action levels significantly below their DRLs as a means of detecting elevated releases meriting follow-up investigations and actions to ensure releases are adequately controlled.
The following tables provide the annual load of key radionuclides directly released to atmosphere or to surface waters from licensed facilities operated by CNL for the reporting period of 2015-2019. Applicable DRLs are also presented where they exist. There are no comparisons to limits and guidelines for the PHP or PGP as the limits in licences are based on either monthly mean, weekly mean, or grab samples.
Over this reporting period, there have been no licence limit exceedances.
As CNL is the licence holder for the G-1 waste facility, releases would be reported in this ROR. However, an effluent monitoring plan assessment conducted in 2016 confirmed that there is minimal or no source of airborne radioactivity at G-1. Therefore, airborne emissions are no longer monitored. Furthermore, all liquids from facility sumps were transferred to the Gentilly-2 facility effluent system to be managed and discharged by Hydro-Quebec.
CNSC staff have commenced publishing annual releases of radionuclides to the environment from nuclear facilities on the CNSC Open Government Portal: https://open.canada.ca/data/en/dataset/6ed50cd9-0d8c-471b-a5f6-26088298870e.
Chalk River Laboratories
| Year | Elemental Tritium (Bq) | Tritium: (HTO: Bq) | Carbon-14 (Bq) | Iodine-131 (Bq) | Noble Gas (Bq-MeV) | Argon-41 (Bq) | Xenon-133 (Bq) |
|---|---|---|---|---|---|---|---|
| DRL | 3.84E+17 | 1.25E+16 | 2.14E+15 | 3.96E+12 | 4.96E+16 | 6.50E+16 | 8.35E+17 |
| 2019 | 5.51E+12 | 1.98E+14 | 3.44E+10 | 2.14E+07 | N/A a | N/A b | N/A c |
| 2018 | 6.86E+12 | 2.29E+14 | 2.54E+11 | 1.02E+08 | 6.50E+12 | 2.59E+15 | N/A c |
| 2017 | 4.64E+12 | 2.50E+14 | 4.90E+11 | 3.82E+08 | 6.50E+12 | 1.16E+16 | N/A c |
| 2016 | 2.55E+12 | 2.30E+14 | 4.84E+11 | 5.17E+10 | 8.50E+14 | 1.07E+16 | 3.12E+15 |
| 2015 | 4.77E+12 | 2.77E+14 | 3.77E+11 | 1.03E+11 | 1.20E+15 | 1.29E+16 | 4.89E+15 |
a After the safe shutdown of the Molybdenum Production Facility, there are no airborne releases of noble gases
b After the safe shutdown of the Nuclear Reactor Universal (NRU) reactor, there are no airborne releases of Argon-41
c After the safe shutdown of the Molybdenum Production Facility, there are no airborne releases of Xenon-133
| Year | Tritium: (HTO: Bq) | Gross Alpha (Bq) | Gross Beta (Bq) |
|---|---|---|---|
| DRL | 1.03E+17 | 1.32E+12 | 2.70E+13 |
| 2019 | 1.37E+13 | 4.62E+08 | 2.75E+10 |
| 2018 | 1.93E+13 | 6.88E+08 | 2.84E+10 |
| 2017 | 3.81E+13 | 7.66E+08 | 4.17E+10 |
| 2016 | 3.50E+13 | 6.60E+08 | 3.22E+10 |
| 2015 | 3.94E+13 | 6.94E+08 | 3.96E+10 |
Whiteshell Laboratories
| Year | Tritium: (HTO: Bq) | Gross Alpha (Bq) | Gross Beta (Bq) |
|---|---|---|---|
| DRL | 8.58E+16 | 9.00E+10 | 3.60E+11 |
| 2019 | 3.34E+10 | 9.31E+04 | 3.27E+05 |
| 2018 | 1.31E+10 | 9.13E+04 | 1.70E+05 |
| 2017 | 5.03E+10 | 9.34E+04 | 2.24E+05 |
| 2016 | 3.24E+10 | 9.46E+04 | 2.12E+05 |
| 2015 | 9.88E+10 | 9.79E+04 | 2.26E+05 |
| Year | Gross Alpha (Bq) | Uranium- total (Bq) | Plutonium-239/240 (Bq) | Plutonium-238 (Bq) | Americium-241 (Bq) | Gross Beta (Bq) | Strontium-90 (Bq) | Cesium-137 (Bq) |
|---|---|---|---|---|---|---|---|---|
| DRL | 1.33E+10 | 1.50E+11 | 1.33E+10 | 1.39E+10 | 1.25E+10 | a | 1.56E+11 | 1.39E+11 |
| 2019 | 5.82E+07 | 1.49E+07 | 4.70E+07 | 4.86E+07 | 2.01E+07 | 3.43E+08 | 5.95E+07 | 2.11E+07 |
| 2018 | 3.90E+07 | 1.16E+07 | 2.32E+07 | 1.84E+07 | 4.21E+06 | 1.94E+08 | 3.21E+07 | 1.51E+07 |
| 2017 | 3.88E+07 | 1.69E+07 | 1.20E+07 | 8.69E+06 | 5.10E+06 | 2.97E+08 | 6.67E+07 | 1.89E+07 |
| 2016 | 4.59E+07 | N/Ab | N/Ab | N/Ab | N/Ab | 2.83E+08 | 6.08E+07 | 1.28E+07 |
| 2015 | 4.08E+07 | N/Ab | N/Ab | N/Ab | N/Ab | 2.23E+08 | 3.96E+07 | 1.65E+07 |
a There is no DRL for gross beta because there is a DRL for the regulated components of gross beta (cesium-137 and strontium-90)
b Monitoring of uranium-total, Plutonium-239/240, Plutonium-238, and Americium-241 began in 2017
Port Hope Area Initiative
Table D-5 shows releases from the Port Granby Project and Table D-6 shows releases from the Port Hope Project. For both projects, the loadings were calculated by multiplying the monthly total volume released by the monthly average concentrations. The total annual loadings are a sum of the monthly loads. There were no exceedances of regulatory limits.
Port Granby Project
CNL began using the new Waste Water Treatment Plant in 2016 to treat contaminated water at the PGP.
| Year | Radium-226 (MBq) | Uranium (kg) |
|---|---|---|
| 2019 | 2.2 | 2.7 |
| 2018 | 1.0 | 1.3 |
| 2017 | 1.0 | 1.4 |
| 2016 | 2.4 | 15.6 |
| 2015 | 4.6 | 29.0 |
Port Hope Project
CNL began using the new Waste Water Treatment Plant in 2017 to treat contaminated water, in place of the old Water Treatment Building. During heavy rainfall events in 2017, 2018, and 2019, CNL restarted the old Water Treatment Building to treat excess contaminated water, in accordance with their water contingency plan, in order to avoid a release of untreated water to the environment.
| Year | Radium-226 (MBq) | Uranium (kg) |
|---|---|---|
| 2019 | 13.6 | 6.9 |
| 2018 | 6.2 | 14.3 |
| 2017 | 16.6 | 110.2 |
| 2016 | 3.3 | 19.3 |
| 2015 | 4.5 | 20.7 |
Douglas Point
| Year | Tritium: (HTO: Bq) | Gross Alpha (Bq) | Gross Beta (Bq) | Carbon-14 (Bq) |
|---|---|---|---|---|
| DRL | 5.46E+17 | N/A | 3.69E+12 | 3.22E+15 |
| 2019 | 2.41E+11 | 4.90E+03 | 3.90E+04 | N/Ac |
| 2018 | 7.96E+11 | 3.07E+03 | 4.55E+04 | 1.51E+09 |
| 2017 | 1.12E+11 | 1.64E+03 | 2.29E+04 | N/Ab |
| 2016 | 1.59E+11 | 1.68E+03 | 1.91E+04 | N/Ab |
| 2015 | 1.33E+10 | N/Aa | N/Aa | N/Ab |
a Monitoring of gross alpha and gross beta began in 2016
b Monitoring of Carbon-14 was completed in 2018 for activities that had potential for a measurable release of C-14
c C-14 was not measured in 2019 because there were no projects identified that had the potential to generate C-14 emissions
| Year | Tritium: (HTO: Bq) | Gross Alpha (Bq) | Gross Beta (Bq) |
|---|---|---|---|
| DRL | 2.04E+17 | N/A | 3.43E+13 |
| 2019 | 3.73E+10 | 6.75E+06 | 4.52E+07 |
| 2018 | 2.73E+10 | 1.18E+07 | 1.97E+07 |
| 2017 | 3.57E+10 | 1.12E+07 | 2.56E+07 |
| 2016 | 2.23E+10 | 9.00E+06 | 1.05E+07 |
| 2015 | 4.24E+10 | N/Aa | 7.31E+07 |
a Monitoring of gross alpha began in 2016
Nuclear Power Demonstration
| Year | Tritium: (HTO: Bq) | Gross Beta (Bq) |
|---|---|---|
| DRL | 4.52E+16 | 3.83E+12 |
| 2019 | 1.59E+11 | 4.21E+04 |
| 2018 | 3.08E+11 | 4.23E+04 |
| 2017 | 1.48E+12 | 1.84E+05 |
| 2016 | 2.53E+11 | 4.30E+04 |
| 2015 | 2.15E+11 | 4.81E+04 |
| Year | Tritium: (HTO: Bq) | Gross Beta (Bq) |
|---|---|---|
| DRL | 4.33E+17 | 2.56E+13 |
| 2019 | 2.52E+10 | 4.06E+07 |
| 2018 | 1.80E+09 | 5.91E+07 |
| 2017 | 7.21E+10 | 1.80E+08 |
| 2016 | 6.57E+10 | 3.33E+07 |
| 2015 | 6.61E+10 | 4.13E+06 |
E. ESTIMATED DOSE TO THE PUBLIC
This appendix contains information on the estimated dose to the public around CNL sites. Regulatory release limits known as derived release limits or DRLs are site-specific calculated releases that could, if exceeded, expose a member of the public of the most highly exposed group to a committed dose equal to the regulatory annual dose limit of 1 mSv/y. DRLs are calculated using CSA standard N288.1-14, Guidelines for calculating derived release limits for radioactive materials in airborne and liquid effluents for normal operation of nuclear facilities.
As per the Radiation Protection Regulations subsection 1(3), and considering the fact that the radiological releases from all the sites covered by this ROR have remained small fractions of the DRLs applicable to those sites, the contribution to the dose to the public from these releases remains a very small fraction of the prescribed limit for the general public.
Chalk River Laboratories
The maximum dose in each year since 2015 has been well below the dose limit of 1 mSv/y. Furthermore, at no point during this period have the emissions from the CRL site exceeded the constraint for dose to the public of 0.30 mSv/y.
| Dose Data | 2015 | 2016 | 2017 | 2018 | 2019 | Regulatory Limit |
|---|---|---|---|---|---|---|
| Maximum Effective Dose (mSv) | 0.0820 | 0.0780 | 0.0870 | 0.0360 | 0.0039 | 1 mSv/y |
Whiteshell Laboratories
The dose to critical groups from releases from CNL-WL in 2019 was 0.00009 mSv, which is well below the regulatory dose limit of 1 mSv/y.
| Dose Data | 2015 | 2016 | 2017 | 2018 | 2019 | Regulatory Limit |
|---|---|---|---|---|---|---|
| Maximum effective dose (mSv) | 0.00004 | 0.00007 | 0.00005 | 0.00004 | 0.00009 | 1 mSv/y |
Port Hope Area Initiative
A modified approach for calculating estimated dose to the public was performed by CNL for PHAI sites in 2019, and included both radon monitoring and fence line dosimeter measurements at both PHP and PGP sites.
The annual estimated doses to the public in 2019 were 0.0396 mSv/y at PGP and 0.036 mSv/y at PHP, which are well below the annual regulatory dose limit of 1 mSv.
| Dose data | 2015 | 2016 | 2017 | 2018 | 2019 | Regulatory limit |
|---|---|---|---|---|---|---|
| Maximum effective dose (mSv) | 0.0084 | 0.0054 | 0.0057 | 0.0200 | 0.0396 | 1 mSv/y |
| Dose data | 2015 | 2016 | 2017 | 2018 | 2019 | Regulatory limit |
|---|---|---|---|---|---|---|
| Maximum effective dose (mSv) | 0.0935 | 0.0120 | 0.0045 | 0.0275 | 0.0360 | 1 mSv/y |
Douglas Point Waste Facility
In 2016, CNL conducted a gap analysis against CSA N288.4, Environmental monitoring programs at Class I nuclear facilities and uranium mines and mills, and determined that given the very low levels of contaminants in airborne and waterborne effluents, there was no regulatory requirement for an Environmental Monitoring Program at DP. CNSC staff reviewed and accepted this gap analysis. All releases of radioactive material in DP effluents are a small fraction of their respective DRLs and thus, continue to indicate minimal impact on the public or the environment.
Gentilly-1 Waste Facility
The effluent monitoring plan assessment conducted in 2016 by CNL determined that there is minimal or no source of airborne radioactivity from routine operations at G-1. In addition, all liquid releases were discharged through Gentilly-2 effluent system, operated by Hydro-Québec, and represent a small fraction of the total releases from the larger Gentilly site. The Hydro-Québec’s Gentilly-2 environmental monitoring program captures any environmental impacts from the small contribution from G-1. The dose to the public from the Gentilly-2 nuclear site, including contributions from G-1, remain below 0.01 mSv/y.
Nuclear Power Demonstration Waste Facility
NPD is no longer discharging liquid effluents from the facility sumps to the Ottawa River, and there were no such releases during the 2019 reporting period. All other releases of radioactive material in NPD effluents are a small fraction of their respective DRLs and thus, continue to indicate minimal impact on the public or the environment. CNL’s environmental monitoring at CRL will regionally overlap with the NPD waste facility, so information from CRL’s off-site environmental monitoring program could also be considered. CNSC staff have determined that the public dose from NPD remains at a very small fraction of the public dose limit.
F. DOSES TO NUCLEAR ENERGY WORKERS AND NON-NUCLEAR ENERGY WORKERS AT CNL SITES
This appendix presents information on doses to Nuclear Energy Workers (NEWs) and non-NEWs at CNL sites.
Chalk River Laboratories
Figure F-1 provides the average effective doses and the maximum effective doses to NEWs at CRL from 2015 to 2019. In 2019, the maximum effective dose received by a NEW at CRL was 8.23 mSv; approximately 16 percent of the regulatory limit for effective dose of 50 mSv in a one-year dosimetry period.
The dose fluctuations from year to year are attributed to the scope and duration of the radiological work conducted, along with the dose rates associated with the work. No adverse trends were identified in 2019.
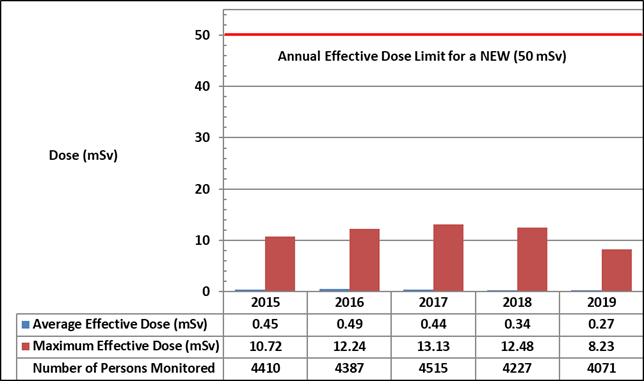
Figure F-1: Text version
| Dose Data | 2015 | 2016 | 2017 | 2018 | 2019 |
|---|---|---|---|---|---|
| Average Effective Dose (mSv) | 0.45 | 0.49 | 0.44 | 0.34 | 0.27 |
| Maximum Effective Dose (mSv) | 10.72 | 12.24 | 13.13 | 12.48 | 8.23 |
| Number of Persons Monitored | 4410 | 4387 | 4515 | 4227 | 4071 |
Note: Annual effective dose limit for a NEW (50 mSv).
As shown in tables F-1a and F-1b, equivalent doses (skin and extremity) at the CRL site were below the CNSC regulatory equivalent dose limits for a NEW of 500 mSv/y. The maximum equivalent (skin) dose received by a NEW in 2019 was 9.65 mSv; approximately 2 percent of the regulatory limit for equivalent dose to the skin of 500 mSv in a one-year dosimetry period. The maximum equivalent (extremity) dose received by a NEW in 2019 was 21.38 mSv; approximately 4 percent of the regulatory limit for equivalent dose to the hands and feet of 500 mSv in a one-year dosimetry period.
| Dose data | 2015 | 2016 | 2017 | 2018 | 2019 | Regulatory limit |
|---|---|---|---|---|---|---|
| Average skin dose (mSv) | 0.55 | 0.60 | 0.53 | 0.40 | 0.29 | n/a |
| Maximum skin dose (mSv) | 15.75 | 16.54 | 19.95 | 15.84 | 9.65 | 500 mSv/y |
| Dose data | 2015 | 2016 | 2017 | 2018 | 2019 | Regulatory limit |
|---|---|---|---|---|---|---|
| Average extremity dose (mSv) | 2.84 | 3.71 | 6.10 | 4.85 | 2.21 | n/a |
| Maximum extremity dose (mSv) | 29.32 | 41.59 | 85.06 | 44.83 | 21.38 | 500 mSv/y |
Non-NEWs at CRL
In 2019, the maximum annual effective dose received by a non-NEW was 0.3 mSv; 30 percent of the regulatory limit for effective dose of 1 mSv in a one-year dosimetry period.
Whiteshell Laboratories
Figure F-2 provides the average effective doses and the maximum effective doses received by NEWs at WL from 2015 to 2019. In 2019, the maximum effective dose received by a NEW at WL was 3.09 mSv; approximately 6 percent of the regulatory limit for effective dose of 50 mSv in a one-year dosimetry period.
The dose fluctuations from year to year are attributed to the scope and duration of the radiological work conducted, along with the dose rates associated with the work. No adverse trends were identified in 2019.
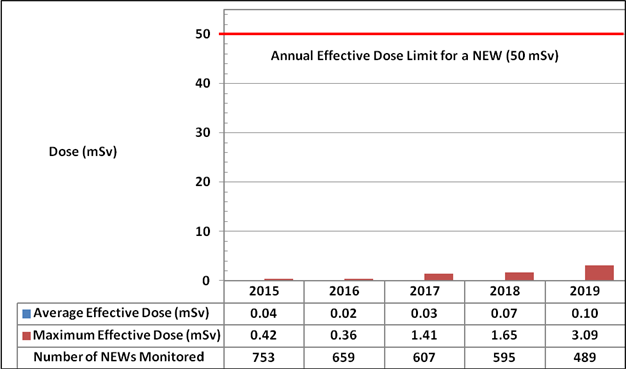
Figure F-2: Text version
| Dose Data | 2015 | 2016 | 2017 | 2018 | 2019 |
|---|---|---|---|---|---|
| Average Effective Dose (mSv) | 0.04 | 0.02 | 0.03 | 0.07 | 0.10 |
| Maximum Effective Dose (mSv) | 0.42 | 0.36 | 1.41 | 1.65 | 3.09 |
| Number of NEWs Monitored | 753 | 659 | 607 | 595 | 489 |
Note: Annual effective dose limit for a NEW (50 mSv).
As shown in tables F-2a and F-2b, equivalent doses (skin and extremity) at the WL site were below the CNSC regulatory equivalent dose limits for a NEW of 500 mSv/y. The maximum equivalent (skin) dose received by a NEW in 2019 was 7.47 mSv; approximately 1.5 percent of the regulatory limit for equivalent dose to the skin of 500 mSv in a one-year dosimetry period. The maximum equivalent (extremity) dose received by a NEW in 2019 was 37.77 mSv; approximately 7.5 percent of the regulatory limit for equivalent dose to the hands and feet of 500 mSv in a one-year dosimetry period.
| Dose data | 2015 | 2016 | 2017 | 2018 | 2019 | Regulatory limit |
|---|---|---|---|---|---|---|
| Average skin dose (mSv) | 0.04 | 0.02 | 0.05 | 0.12 | 0.20 | n/a |
| Maximum skin dose (mSv) | 0.65 | 0.36 | 2.90 | 3.72 | 7.47 | 500 mSv/y |
| Dose data | 2015 | 2016 | 2017 | 2018 | 2019 | Regulatory limit |
|---|---|---|---|---|---|---|
| Average extremity dose (mSv) | 0.09 | 0.05 | 1.51 | 5.02 | 4.80 | n/a |
| Maximum extremity dose (mSv) | 0.72 | 0.11 | 11.35 | 36.71 | 37.77 | 500 mSv/y |
Non-NEWs at WL
In 2019, external dosimeters issued to non-NEWs at WL did not record any measureable doses.
Port Hope Area Initiative
Port Granby
Figure F-3 provides the average effective doses and the maximum effective doses for NEWs at the PGP from 2015 to 2019. In 2019, the maximum effective dose received by a NEW at the PGP was 0.79 mSv, which is well below the CNSC’s annual regulatory effective dose limit of 50 mSv. The total number of NEWs includes all contractors involved in work at the PGP as well as CNL staff.
Effective doses were trending down in 2019 due to work activities at the PGP nearing completion of excavation activities, and with the focus turning to capping of the Long-Term Waste Management Facility (LTWMF).
.png/object?subscription-key=3ff0910c6c54489abc34bc5b7d773be0)
Figure F-3: Text version
| Dose Data | 2015 | 2016 | 2017 | 2018 | 2019 |
|---|---|---|---|---|---|
| Average Effective Dose (mSv) | 0.01 | 0.01 | 0.03 | 0.06 | 0.05 |
| Maximum Effective Dose (mSv) | 0.16 | 0.30 | 0.39 | 3.13 | 0.79 |
| Number of NEWs Monitored | 118 | 309 | 430 | 489 | 560 |
Note: Annual effective dose limit for a NEW (50 mSv).
As shown in Table F-3, skin doses at the PGP were well below the CNSC regulatory equivalent dose limit for a NEW of 500 mSv/y. The maximum skin dose for a NEW at the PGP in 2019 was 0.79 mSv, and the average skin dose for all NEWs was 0.05 mSv.
| Dose data | 2015 | 2016 | 2017 | 2018 | 2019 | Regulatory limit |
|---|---|---|---|---|---|---|
| Average skin dose (mSv) | 0.01 | 0.01 | 0.04 | 0.05 | 0.05 | n/a |
| Maximum skin dose (mSv) | 0.16 | 0.30 | 0.34 | 2.44 | 0.79 | 500 mSv/y |
Port Hope
Figure F-4 provides the average effective doses and the maximum effective doses for NEWs at the PHP from 2015 to 2019. In 2019, the maximum effective dose received by a NEW at the PHP was 0.38 mSv, which is well below the CNSC’s annual regulatory effective dose limit of 50 mSv. The total number of NEWs includes all contractors involved in work at the PHP as well as CNL staff.
Effective doses remained low in 2019 as there were no significant changes in the scope of work activities at the PHP.
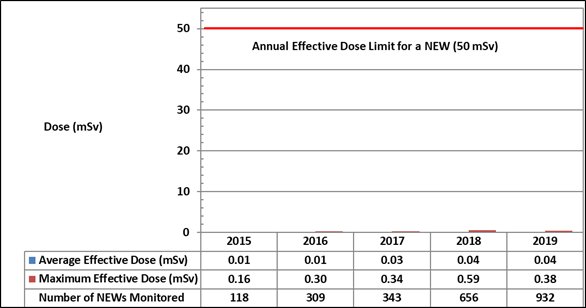
Figure F-4: Text version
| Dose Data | 2015 | 2016 | 2017 | 2018 | 2019 |
|---|---|---|---|---|---|
| Average Effective Dose (mSv) | 0.01 | 0.01 | 0.03 | 0.04 | 0.04 |
| Maximum Effective Dose (mSv) | 0.16 | 0.30 | 0.34 | 0.59 | 0.38 |
| Number of NEWs Monitored | 118 | 309 | 343 | 656 | 932 |
Note: Annual effective dose limit for a NEW (50 mSv).
As shown in Table F-4, skin doses at the PHP were also well below the CNSC regulatory equivalent dose limit for a NEW of 500 mSv/y. The maximum skin dose for a NEW at the PHP in 2019 was 0.60 mSv, and the average skin dose for all NEWs was 0.04 mSv.
| Dose data | 2015 | 2016 | 2017 | 2018 | 2019 | Regulatory limit |
|---|---|---|---|---|---|---|
| Average skin dose (mSv) | 0.01 | 0.01 | 0.04 | 0.04 | 0.04 | n/a |
| Maximum skin dose (mSv) | 0.16 | 0.30 | 0.34 | 0.33 | 0.60 | 500 mSv/y |
Non-NEWs at Port Hope Area Initiative
Doses to non-NEWs at the Port Hope Area Intitiative are either estimated based on radiological conditions of areas visited, or directly monitored by using electronic personal dosimeters (EPDs).
In 2019, the maximum annual effective doses received by non-NEWs were 0.02 mSv at the PGP, and 0.04 mSv at the PHP. These doses are well below the annual regulatory dose limit of 1 mSv in a one-year dosimetry period.
DP, G-1 and NPD Waste Facilities
Douglas Point Waste Facility
Figure F-5 provides the average effective doses and the maximum effective doses for NEWs at DP from 2015 to 2019. In 2019, the maximum effective dose received by a NEW at DP was 0.24 mSv, which is well below the CNSC’s annual regulatory effective dose limit of 50 mSv.
There has been an increase in the number of workers since 2015 at DP, mainly attributed to an increase in the execution of planned hazard reduction work activities such as the Spent Resin Removal Project and dry active waste removal campaigns. These work activities resulted in slight increases in the maximum effective doses observed in 2017 and 2018.
.png/object?subscription-key=3ff0910c6c54489abc34bc5b7d773be0)
Figure F-5: Text version
| Dose Data | 2015 | 2016 | 2017 | 2018 | 2019 |
|---|---|---|---|---|---|
| Average Effective Dose (mSv) | 0.00 | 0.01 | 0.01 | 0.01 | 0.02 |
| Maximum Effective Dose (mSv) | 0.06 | 0.11 | 0.37 | 0.43 | 0.24 |
| Number of NEWs Monitored | 64 | 80 | 92 | 123 | 74 |
Note: Annual effective dose limit for a NEW (50 mSv).
Annual average and maximum equivalent (skin) dose results for NEWs at DP from 2015 to 2019 are provided in Table F-5. In 2019, the maximum skin dose received by a NEW at DP was 0.24 mSv, which is well below the CNSC’s annual regulatory equivalent dose limit of 500 mSv/y.
| Dose data | 2015 | 2016 | 2017 | 2018 | 2019 | Regulatory limit |
|---|---|---|---|---|---|---|
| Average skin dose (mSv) | 0.00 | 0.01 | 0.01 | 0.01 | 0.02 | n/a |
| Maximum skin dose (mSv) | 0.06 | 0.11 | 0.37 | 0.43 | 0.24 | 500 mSv/y |
Non-NEWs at DP
In 2019, external dosimeters issued to non-NEWs at DP did not record any measureable doses.
Gentilly-1 Waste Facility
Figure F-6 provides the average effective doses and the maximum effective doses for NEWs at Gentilly-1 from 2015 to 2019. In 2019, the maximum effective dose received by a NEW at Gentilly-1 was 0.10 mSv, which is well below the CNSC’s annual regulatory effective dose limit of 50 mSv.
Since 2015, there has been an increase in the number of workers on site at G-1, along with slight increases in radiation doses for NEWs, due to an increase in planned work activities (both maintenance tasks and project activities), including the Spent Resin Removal Project in 2018.
.png/object?subscription-key=3ff0910c6c54489abc34bc5b7d773be0)
Figure F-6: Text version
| Dose Data | 2015 | 2016 | 2017 | 2018 | 2019 |
|---|---|---|---|---|---|
| Average Effective Dose (mSv) | 0.01 | 0.01 | 0.01 | 0.03 | 0.01 |
| Maximum Effective Dose (mSv) | 0.04 | 0.08 | 0.18 | 0.62 | 0.10 |
| Number of NEWs Monitored | 22 | 49 | 83 | 101 | 57 |
Note: Annual effective dose limit for a NEW (50 mSv).
Annual average and maximum equivalent (skin) dose results for NEWs at G-1 from 2015 to 2019 are provided in Table F-6. In 2019, the maximum skin dose received by a NEW at G-1 was 0.16 mSv, which is well below the CNSC’s annual regulatory equivalent dose limit of 500 mSv.
| Dose data | 2015 | 2016 | 2017 | 2018 | 2019 | Regulatory limit |
|---|---|---|---|---|---|---|
| Average skin dose (mSv) | 0.01 | 0.01 | 0.01 | 0.03 | 0.01 | n/a |
| Maximum skin dose (mSv) | 0.04 | 0.08 | 0.18 | 0.62 | 0.16 | 500 mSv/y |
Non-NEWs at Gentilly-1
In 2019, external dosimeters issued to non-NEWs at G-1 did not record any measureable doses.
Nuclear Power Demonstration Waste Facility
Figure F-7 provides the average effective doses and the maximum effective doses for NEWs at NPD from 2015 to 2019. In 2019, the maximum effective dose received by a NEW at NPD was 0.05 mSv, which is well below the CNSC’s annual regulatory effective dose limit of 50 mSv.
Effective doses during the years 2015 and 2016 were consistently low and reflect storage with surveillance (SWS) activities such as routine inspection and maintenance, as well as some hazard reduction activities. Doses in 2017 saw a sharp increase due to planned work activities involving engineering assessments, thorough facility characterization and large scale hazard reduction activities (asbestos abatement). Following the 2017 increase, doses in 2018 and 2019 have returned to levels seen previously during SWS activities, while remaining characterization and engineering activities occurred.
.png/object?subscription-key=3ff0910c6c54489abc34bc5b7d773be0)
Figure F-7: Text version
| Dose Data | 2015 | 2016 | 2017 | 2018 | 2019 |
|---|---|---|---|---|---|
| Average Effective Dose (mSv) | 0.00 | 0.00 | 0.05 | 0.00 | 0.03 |
| Maximum Effective Dose (mSv) | 0.12 | 0.05 | 3.02 | 0.09 | 0.05 |
| Number of NEWs Monitored | 211 | 212 | 265 | 186 | 167 |
Note: Annual effective dose limit for a NEW (50 mSv).
Annual average and maximum equivalent (skin) dose results for NEWs at NPD, from 2015 to 2019, are provided in Table F-7. In 2019, the maximum skin dose received by a NEW at NPD was 0.05 mSv, which is well below the CNSC’s annual regulatory equivalent dose limit of 500 mSv.
| Dose data | 2015 | 2016 | 2017 | 2018 | 2019 | Regulatory limit |
|---|---|---|---|---|---|---|
| Average skin dose (mSv) | 0.00 | 0.00 | 0.04 | 0.00 | 0.03 | n/a |
| Maximum skin dose (mSv) | 0.12 | 0.05 | 3.03 | 0.09 | 0.05 | 500 mSv/y |
Non-NEWs at NPD
In 2019, external dosimeters issued to non-NEWs at NPD did not record any measureable doses.
G. LOST-TIME INJURY INFORMATION
This appendix contains information on the number, frequency and severity of recordable lost-time injuries at the CNL sites covered by this ROR, with information presented separately for CNL employees and contractors.
CNL Employees
Frequency and severity are calculated per 100 full-time workers (equivalent to 200,000 worker-hours per year) using the following formulas:
Frequency rate = (# of Lost-Time Injuries) x (200 000 hrs of exposure) / (person hours worked)
Severity rate = (# of Working Days Lost) x (200 000 hrs of exposure) / (person hours worked)
| Year | 2015 | 2016 | 2017 | 2018 | 2019 |
|---|---|---|---|---|---|
| Person Hours Worked (all CNL) | 6 294 295 | 6 405 670 | - | - | - |
| Person Hours Worked | - | - | 5 597 015 | 5 396 450 | 5 729 010 |
| Lost-Time Injuries | 2 | 6 | 4 | 5 | 1 |
| Working Days Lost | 7 | 47 | 10 | 69 | 75 |
| Frequency | 0.06 | 0.19 | 0.14 | 0.19 | 0.03 |
| Severity | 0.22 | 1.47 | 0.36 | 2.56 | 2.62 |
Note that prior to 2017, CNL did not provide data for person-hours worked on CRL site alone, therefore total CNL hours worked are used in place of that data. This skews frequency and severity data for the CRL site for the 2014-2016 years, and makes comparison between pre- and post-2017 data for CRL difficult. | |||||
For 2019, 75 working days were lost at CRL, the most since 2015. The majority of these days are attributable to one CNL employee who sustained a shoulder injury that required subsequent surgery.
| Year | 2015 | 2016 | 2017 | 2018 | 2019 |
|---|---|---|---|---|---|
| Person Hours Worked | 741 000 | 684 450 | 706 000 | 688 000 | 642 000 |
| Lost-Time Injuries | 0 | 1 | 3 | 1 | 0 |
| Working Days Lost | 0 | 5 | 27 | 5 | 0 |
| Frequency | 0 | 0.29 | 0.85 | 0.28 | 0 |
| Severity | 0 | 1.46 | 7.67 | 1.45 | 0 |
CNL employees at WL did not have any recordable lost-time injuries in 2019
| Year | 2015 | 2016 | 2017 | 2018 | 2019 |
|---|---|---|---|---|---|
| Person Hours Worked | N/A | N/A | N/A | N/A | 298 377 |
| Lost-Time Injuries | 0 | 0 | 0 | 0 | 1 |
| Working Days Lost | 0 | 0 | 0 | 0 | 33 |
| Frequency | 0 | 0 | 0 | 0 | 0.68 |
| Severity | 0 | 0 | 0 | 0 | 22.57 |
| Year | 2015 | 2016 | 2017 | 2018 | 2019 |
|---|---|---|---|---|---|
| Person Hours Worked | N/A | N/A | N/A | N/A | 41 622 |
| Lost-Time Injuries | 0 | 0 | 0 | 0 | 1 |
| Working Days Lost | 0 | 0 | 0 | 0 | 1 |
| Frequency | 0 | 0 | 0 | 0 | 4.81 |
| Severity | 0 | 0 | 0 | 0 | 4.81 |
CNL staff at the DP, G-1, and NPD sites have not recorded a lost-time injury since 2015.
Contractors at CNL sites
The number of contractor recordable lost-time incidents reported to CNL in 2019 is shown in Table G-5.
CNL records the number of lost time incidents reported to CNL by their contractors. However, contractor employee hours worked is considered sensitive information and the contractors do not divulge the specific number of hours worked to CNL as their client. Therefore, CNL does not provide frequency and severity rates for contractors since these calculations require hours worked.
| Site | CRL | WL | NPD | G-1 | DP | PHP | PGP |
|---|---|---|---|---|---|---|---|
| Lost-Time Injuries | 0 | 0 | 0 | 0 | 0 | 1 | 1 |
H. PARTICIPANT FUNDING AWARDED FOR THE 2019 CNL REGULATORY OVERSIGHT REPORT
| Recipient | Amount (up to) |
|---|---|
| Algonquins of Ontario | $11,700 |
| Canadian Environmental Law Association | $5,880 |
| Grand Council Treaty #3 | $4,000 |
| Manitoba Métis Federation | $11,700 |
| Concerned Citizens of Renfrew County | $2,500 |
| Curve Lake First Nation | $5,676 |
I. INDIGENOUS COMMUNITIES AND GROUPS WHOSE TRADITIONAL AND/OR TREATY TERRITORIES ARE IN PROXIMITY TO CNL SITES
Chalk River Laboratories and Nuclear Power Demonstration
- Algonquins of Ontario
- Algonquins of Pikwàkanagàn
- Métis Nation of Ontario
- Algonquin Anishinabeg Nation Tribal Council
- Kebaowek First Nation
- Kitigan Zibi Anishinabeg First Nation
- Anishinabek Nation
- the Algonquin Nation Secretariat
- Williams Treaties First Nations:
- Alderville First Nation
- Beausoleil First Nation
- the Chippewas of Georgina Island First Nation
- Chippewas of Rama First Nation
- Curve Lake First Nation
- Hiawatha First Nation
- Mississaugas of Scugog Island First Nation
Whiteshell Laboratories
- Sagkeeng First Nation
- Manitoba Metis Federation
- Brokenhead Ojibway Nation
- Black River First Nation
- Hollow Water First Nation
- Northwest Angle #33
- Shoal Lake #40 First Nation
- Wabaseemoong Independent Nations
- Iskatewizaagegan #39 Independent First Nation
- Grand Council of Treaty 3
Port Hope Project and Port Granby Project
- Mohawks of the Bay of Quinte
- Métis Nation of Ontario
- Williams Treaty First Nations:
- Alderville First Nation
- Beausoleil First Nation
- the Chippewas of Georgina Island First Nation
- Chippewas of Rama First Nation
- Curve Lake First Nation
- Hiawatha First Nation
- Mississaugas of Scugog Island First Nation
Douglas Point
- Saugeen Ojibway Nation (SON):
- Chippewas of Nawash Unceded First Nation
- Saugeen First Nation
- Métis Nation of Ontario (MNO)
- Historic Saugeen Métis (HSM)
Gentilly
- Abénakis of Wôlinak and Odanak, represented by the Grand Conseil de la Nation Waban-Aki
- Nation huronne-wendat
Footnotes
- Footnote 1
-
CRL: Chalk River Laboratories; WL: Whiteshell Laboratories; PHP: Port Hope Project; PGP: Port Granby Project; DP: Douglas Point; G-1: Gentilly-1; NPD: Nuclear Power Demonstration.
- Footnote 2
-
Further information on the DP licence amendment hearing can be found on the CNSC’s Website at: /eng/the-commission/hearings/browse/?dt=2020-11-26"fn-rtn">Return to footnote 2 referrer
- Footnote 3
-
Person-millisieverts is a unit of measurement for the annual collective dose for workers (the sum of the effective doses received by all the workers at a facility in a year)
Page details
- Date modified: